- If you are wondering whether Flutter Entertainment’s share price now reflects a fair deal or an overreaction, you are not alone. This article will help you frame that question clearly.
- The stock has retreated to US$105.53, with returns of a 7.9% decline over the past week, a 30.4% decline over the past month, and a 51.7% decline year to date. These moves may already be reshaping how investors think about its risk and potential reward.
- Recent coverage of Flutter has kept attention on its position in global online betting and gaming, including ongoing commentary about competition, regulation and market share in key regions. That backdrop is an important piece of context when looking at a 54.4% decline over the past year, a 36.5% decline over three years, and a 55.1% decline over five years.
- Against that share price record, Flutter currently has a valuation score of 5 out of 6 on our checks for undervaluation. That sets us up to compare several standard valuation approaches next, before finishing with a broader way to think about what those numbers really mean for you.
Find out why Flutter Entertainment’s -54.4% return over the last year is lagging behind its peers.
Approach 1: Flutter Entertainment Discounted Cash Flow (DCF) Analysis
A Discounted Cash Flow, or DCF, model takes estimates of the cash a company could generate in the future and discounts those amounts back into today’s dollars to arrive at an estimate of what the business might be worth now.
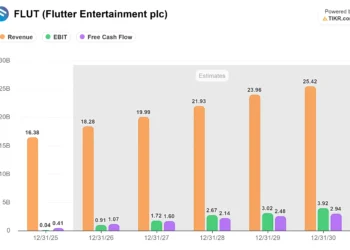
For Flutter Entertainment, the model used is a 2 Stage Free Cash Flow to Equity approach based on cash flow projections. The latest twelve month free cash flow is about US$394.4 million. Analysts and internal estimates project free cash flow rising to US$3.095 billion by 2030, with a detailed path of annual forecasts between 2026 and 2035 that are then discounted back to today using a required return.
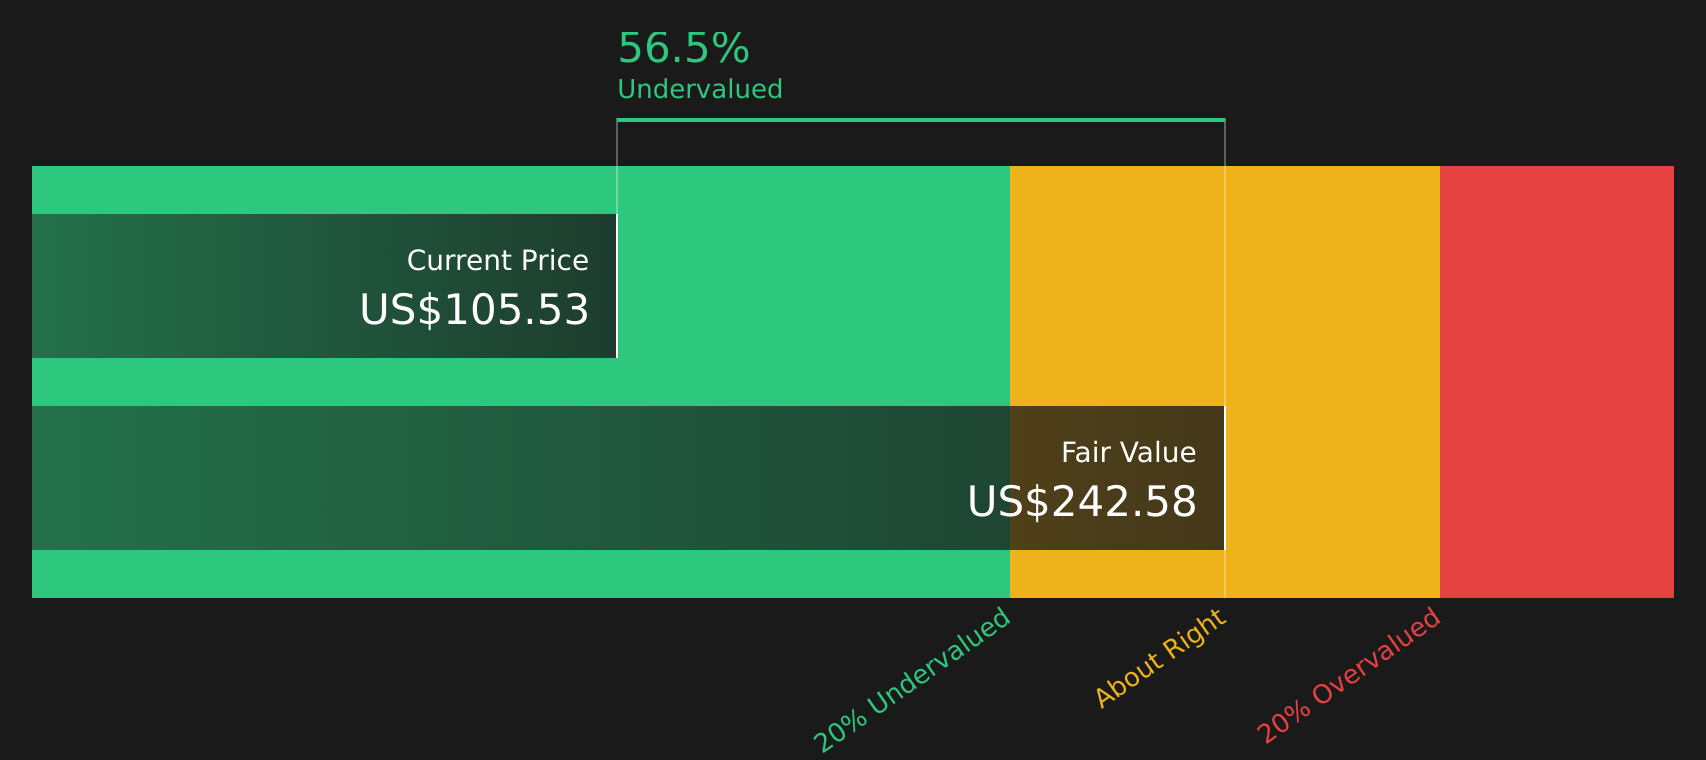
When all those discounted cash flows are added together, the model produces an estimated intrinsic value of US$242.58 per share, compared with a current share price of about US$105.53. That gap implies the shares trade at roughly a 56.5% discount to this DCF estimate, which indicates a wide margin between price and modeled value.
Result: UNDERVALUED
Our Discounted Cash Flow (DCF) analysis suggests Flutter Entertainment is undervalued by 56.5%. Track this in your watchlist or portfolio, or discover 47 more high quality undervalued stocks.
Approach 2: Flutter Entertainment Price vs Sales
For companies where earnings can be volatile or affected by accounting items, the P/S ratio is often a cleaner way to think about what you are paying for each dollar of revenue. It is still shaped by what investors expect for future growth and how much risk they see. Higher expected growth or lower perceived risk can justify a higher P/S ratio, while slower expected growth or higher risk usually lines up with a lower one.
Flutter Entertainment currently trades on a P/S ratio of 1.13x. That compares with an industry average P/S of 1.56x in the wider Hospitality group and a peer average of 1.70x. Simply Wall St also calculates a proprietary “Fair Ratio” of 2.73x, which is the P/S multiple suggested by inputs such as growth estimates, profit margins, risk profile, industry and market capitalization.
This Fair Ratio aims to be more tailored than a simple comparison to peers or the industry because it links the multiple to Flutter’s own characteristics rather than broad group averages. Compared with the current 1.13x P/S, the 2.73x Fair Ratio indicates that Flutter Entertainment is trading below that modelled range.
Result: UNDERVALUED

P/S ratios tell one story, but what if the real opportunity lies elsewhere? Start investing in legacies, not executives. Discover our 18 top founder-led companies.
Upgrade Your Decision Making: Choose your Flutter Entertainment Narrative
Earlier we mentioned that there is an even better way to understand valuation, so on Simply Wall St’s Community page you can use Narratives, where you set out your story for Flutter Entertainment, link that story to specific assumptions for future revenue, earnings, margins and discount rate, see a Fair Value that updates automatically with new news or earnings, and then compare that Fair Value with today’s price to judge your own buy or sell thresholds, whether you lean closer to a higher Fair Value around US$369.27 or a lower one near US$212.74.
Do you think there’s more to the story for Flutter Entertainment? Head over to our Community to see what others are saying!

This article by Simply Wall St is general in nature. We provide commentary based on historical data
and analyst forecasts only using an unbiased methodology and our articles are not intended to be financial advice. It does not constitute a recommendation to buy or sell any stock, and does not take account of your objectives, or your
financial situation. We aim to bring you long-term focused analysis driven by fundamental data.
Note that our analysis may not factor in the latest price-sensitive company announcements or qualitative material.
Simply Wall St has no position in any stocks mentioned.
New: AI Stock Screener & Alerts
Our new AI Stock Screener scans the market every day to uncover opportunities.
• Dividend Powerhouses (3%+ Yield)
• Undervalued Small Caps with Insider Buying
• High growth Tech and AI Companies
Or build your own from over 50 metrics.
Have feedback on this article? Concerned about the content? Get in touch with us directly. Alternatively, email [email protected]
‘ The preceding article may include information circulated by third parties ’
‘ Some details of this article were extracted from the following source simplywall.st ’