Track your investments for FREE with Simply Wall St, the portfolio command center trusted by over 7 million individual investors worldwide.
If you are wondering whether Caesars Entertainment at US$26.88 is a bargain or a value trap, the key is understanding what you are really paying for today.
The stock is up 1.3% over the last week and 14.1% year to date, but that sits alongside a 4.2% decline over the last month and longer term returns of 6.1% over 1 year, 38.2% over 3 years and 71.3% over 5 years.
Those mixed returns sit against a backdrop of ongoing attention on Caesars Entertainment as a major US gaming and hospitality group, with investors regularly weighing the company’s capital intensity and exposure to consumer spending. Recent coverage has focused on how companies in this space balance growth investments with debt levels. This helps frame how the market is currently thinking about risk and reward.
On Simply Wall St’s valuation checks, Caesars Entertainment scores 5 out of 6. The next sections will walk through what that means across different valuation methods, before finishing with a way of assessing value that goes beyond any single model.
A Discounted Cash Flow model estimates what a business could be worth today by projecting the cash it may generate in the future and then discounting those cash flows back to today’s dollars.
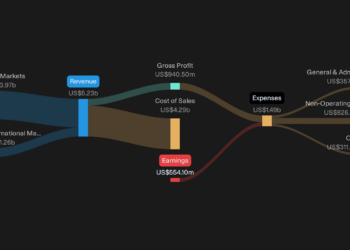
For Caesars Entertainment, the 2 Stage Free Cash Flow to Equity model starts with last twelve months free cash flow of about $157.4 million. Analyst estimates and subsequent extrapolations by Simply Wall St project free cash flow reaching around $1.64b in 2035, with interim years moving through the hundreds of millions of dollars. These projections are expressed in $, which is also the currency of the share price.
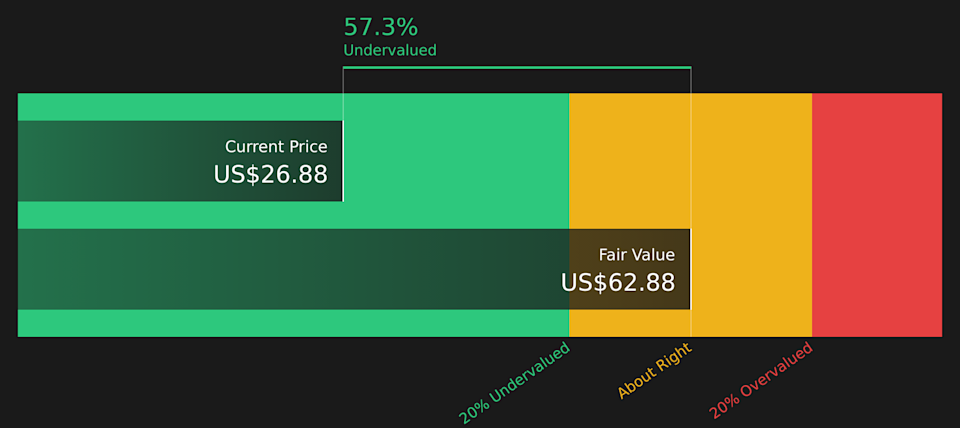
When all those projected cash flows are discounted back, the model arrives at an estimated intrinsic value of about $62.88 per share. Compared with the current share price of roughly $26.88, this points to an implied discount of about 57.3%, indicating that the model’s cash flow based estimate is higher than the current market price.
For companies where earnings can be uneven, the P/S ratio is often a practical way to compare the value the market is placing on each dollar of revenue, especially in sectors like Hospitality where margins can swing with operating conditions.
What counts as a “normal” or “fair” multiple is influenced by how quickly a company is expected to grow its revenue and how risky that growth looks. Higher growth and lower perceived risk can support a higher P/S, while slower growth or higher risk usually points to a lower multiple.
Caesars Entertainment currently trades on a P/S of about 0.48x. That sits below the Hospitality industry average of around 1.56x and the peer average of roughly 1.88x. Simply Wall St’s Fair Ratio for Caesars is 1.33x, which is its estimate of an appropriate P/S given factors such as earnings growth, industry, profit margin, market cap and risk profile. Because this Fair Ratio is tailored to the company’s own characteristics, it can be more informative than a simple comparison with industry or peer averages. With the current 0.48x P/S sitting well below the 1.33x Fair Ratio, the multiple based view points to the shares trading at a discount.
Earlier it was mentioned that there is an even better way to understand valuation. Narratives take the story you believe about Caesars Entertainment, link it to concrete forecasts for revenue, earnings and margins, and then translate that into a Fair Value you can compare with today’s price, all within Simply Wall St’s Community page that is used by millions of investors.
Think of a Narrative as your own clearly written storyline behind the numbers. A more optimistic view on Caesars, such as a Fair Value of about US$41.00 based on higher expected earnings and a P/E near 21.8x in 2029, can sit alongside a more cautious view closer to US$22.00 that assumes slower growth, lower profitability and a very high future P/E. You can see instantly how each storyline compares with the current share price and how it updates when fresh news or earnings arrive.
For Caesars Entertainment, however, we will make it really easy for you with previews of two leading Caesars Entertainment narratives:
Think of these as two clear storylines you can compare with the current share price of about US$26.88, then decide which one feels closer to how you see the business.
🐂 Caesars Entertainment Bull Case
Fair value in this bullish narrative: US$41.00
Implied discount to this fair value: about 34.4% below the narrative fair value today
Revenue growth assumption: 4.0% a year
Analysts in this camp see Caesars converting recent digital and omni channel investment into higher EBITDA, stronger free cash flow and more room to reduce debt and buy back shares.
The storyline assumes profit margins move from a loss today to a positive mid single digit level over the next few years, with earnings reaching about US$508.9m by 2029 and a P/E of 21.8x on those earnings.
Key risks center on high leverage, heavy exposure to the U.S. market and ongoing labor and regulatory pressures, which could all eat into the cash flow profile if conditions turn against the company.
🐻 Caesars Entertainment Bear Case
Fair value in this bearish narrative: US$22.00
Implied premium to this fair value: about 22.2% above the narrative fair value today
Revenue growth assumption: 1.3% a year
This storyline leans on concerns that digital gaming trends, changing demographics and aging properties could limit the profit potential of Caesars large physical casino portfolio.
Analysts here factor in modest revenue growth, thin positive profit margins and a very high future P/E multiple to reach US$87.2m of earnings by 2028, which leaves little room for disappointment at today’s price.
Supportive factors such as growing digital EBITDA, group business in Las Vegas and cost control are acknowledged, but the view is that high leverage and concentrated U.S. exposure keep the risk reward balance tight at current levels.
If you want to see how these bullish and bearish storylines are built line by line, you can review the full narrative set for Caesars on Simply Wall St and compare them side by side before deciding which assumptions fit your own view of the stock.
This article by Simply Wall St is general in nature. We provide commentary based on historical data and analyst forecasts only using an unbiased methodology and our articles are not intended to be financial advice. It does not constitute a recommendation to buy or sell any stock, and does not take account of your objectives, or your financial situation. We aim to bring you long-term focused analysis driven by fundamental data. Note that our analysis may not factor in the latest price-sensitive company announcements or qualitative material. Simply Wall St has no position in any stocks mentioned.