A framework for environmentally sustainable entertainment events
Our framework is based upon both welfare economics and the principle of shared responsibility. We apply a Cost Benefit Analysis (CBA) to determine the viability of a given event. The economic benefit is determined by observing secondary ticket market prices to determine consumer willingness to pay (WTP). WTP is recognised as a legitimate estimate of benefits and has been used in government guidelines on CBA including the U.S.’s Office of Management and Budget15,16,17. Costs are calculated using the SCC to monetise the event’s emissions. If the benefits outweigh the costs, the event is considered climate viable. Still, the question remains of who should pay the costs of these events, for which we suggest the adoption of the principle of shared responsibility, a hybrid solution that allocates costs to both the consumers and the producer18.
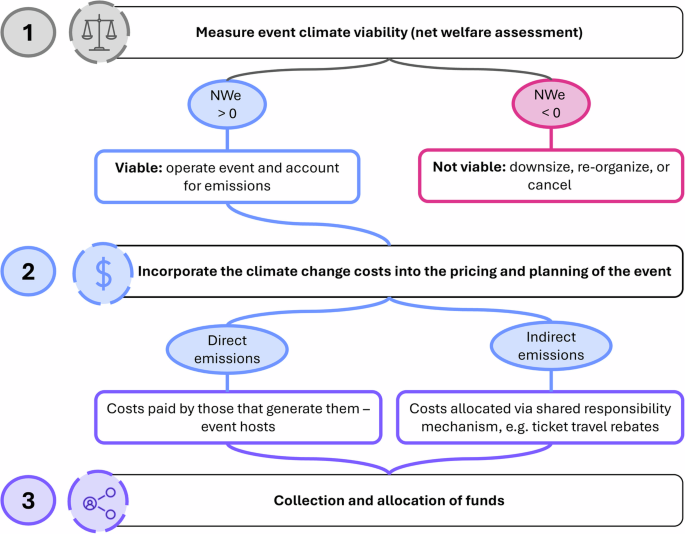
CBAs using the SCC have become a common tool for government decision makers12,19,20,21. Importantly, however, the CBA framework presented here uses a revealed preference method to determine consumer surplus. There are three steps to the framework (see Fig. 1). Our research merges four strands of literature across two fields of study: the environmental impact of music and sporting events, and the economic effects of music and sporting events. It is also applicable to events in other industries (e.g. theatre, conferences and vacations).
NWe refers the net welfare of the event. Step one includes the measurement of total surplus and the quantification of emissions costs.
Work quantifying the damages associated with both music and sporting events is extensive. Carbon footprint analysis has become a popular tool for assessing environmental impacts1,4,22,23,24,25,26. However, these assessments often stand on their own and offer little policy guidance, essentially acting as hazard identification. Literature on the economics of entertainment events, especially live music, is large, with much of it falling under the term ‘Rockonomics’27,28,29,30,31,32,33,34,35,36.
There are also studies comparing the costs and benefits of events, especially in the context of sporting mega-events37,38,39,40,41,42,43. Yet, these studies focus on concrete economic impacts such as employment and substitution effects, and do not normally consider the welfare, nor the environmental externalities. While there are some estimates of WTP for environmental measures in sporting events44, they rely on contingent valuation methods, and do not focus on overall welfare. Some work has investigated so-called “life satisfaction effects”, including a 2008 study that found WTP to host the London Olympics totalled £2 billion45. These studies, however, rely on contingent valuation methods, and the use of consumer surplus estimations to calculate the welfare effects of mega-events does not appear to have been conducted43,46.
We build on the existing environmental pricing literature47, both conceptually and methodologically. We provide an inter-disciplinary conceptual framework for assessing and achieving the climate viability of an event via welfare economics and the principle of shared responsibility. Methodologically, we apply a revealed preference technique by collecting data from secondary ticket market platforms and quantify climate change externalities through the SCC. We note that our approach is limited in that it only considers consumer welfare, ignoring discrete economic impacts such as displacement and expenditure. However, our chosen metric of welfare – consumer surplus – is apt for this CBA framework, since we are concerned primarily with whether spectator utility is greater than or equal to the event’s emissions costs. Furthermore, our use of a revealed preference method for WTP via resale ticket prices represents a replicable strategy for any event with secondary ticket markets.
We provide guidance for policy makers, regulators and organisers seeking an actionable approach to assessing and improving the sustainability of events. To establish the efficacy of this framework, we present both an ex-post and ex-ante case study. The ex-post analysis is conducted on the 2024 Coldplay European tour. The ex-ante analysis is performed on the 2026 FIFA World Cup’s expansion from 32 to 48 teams. This involves an ex-ante estimation of WTP and demonstrates how organisers can incorporate the framework into the decision-making process prior to an event. The differing contexts demonstrate that this framework provides cohesion in assessing and achieving sustainable large-scale entertainment events.
Step 1 tests whether the event is climate viable. If benefits are greater than the costs, the event is deemed to be socially viable. Otherwise, the event should either be scaled down, re-planned to reduce emissions, or cancelled. That is:
$${NWe}\,=\,{TSe}\,-\,{ECe}$$
(f.1)
Where NWe is equal to the net welfare gain or loss of the event, TSe is the total surplus of the event, and ECe is the emissions cost of the event. The decision criteria for organisers are thus:
$${NWe}\, > \,0\to \,{{\mathrm{Viable}}}:\,{{\mathrm{operate}}}\,{{\mathrm{event}}}\,{{\mathrm{and}}}\,{{\mathrm{account}}}\,{{\mathrm{for}}}\,{{\mathrm{emissions}}}$$
(1)
The finding that economic benefits outweigh environmental costs is not carte blanche for an event to operate. Rather, it is grounds for the reallocation of benefits such that the environmental externalities associated with the event are justly accounted for.
The welfare gain can be measured by the consumer surplus (CS) of attendees28,30. CS is the difference between the price charged by the producer and the willingness to pay (WTP) of the consumer to attend the event (CS = WTP – Price). WTP can be measured by observing secondary (resale) ticket markets, where tickets are purchased from the organisers and then resold on a third-party platform33,34. Often, the price is higher than that charged by organisers27,35. The difference between the face value and the resale-value is consumer surplus captured by the reseller30. We observe the prices posted on reselling platforms, not the realised transaction prices, noting that posted and realised transaction prices in secondary ticket markets have been shown to be closely aligned48. Consumer surplus should be understood as potential consumer surplus here, as it depends on the extent of reselling: consumers who purchase on the secondary market at their maximum WTP would realise no surplus, with the difference instead captured by resellers.
Importantly, most producers (i.e. sports clubs or concert organisers) have market power and price discriminate35,49. This sees ticket prices vary by section despite equal marginal production costs (e.g. for centre-stage). Price discrimination allows producers to capture a portion of the total surplus, the producer surplus (PS). The TS captures the total welfare generated by the event:
Estimating the emissions costs involves first estimating the GHGs in tons of carbon dioxide equivalent (CO2-e) and then converting them into a monetary value through the SCC21,50. The SCC measures the cost of an incremental amount of carbon released into the atmosphere12. Emissions can be divided into direct emissions (scope 1 and 2) and indirect emissions (scope 3). Scope 1 refers to emissions from sources owned or controlled by the organiser, scope 2 to indirect emissions from purchased energy, and scope 3 to all other indirect emissions in the value chain, including spectator travel51. Estimating an event’s GHG footprint entails a four-step process51: (1) Scoping and boundary setting; (2) Data collection; (3) Baselining and (4) Scaling up (see methods for further details). The private costs of the event are assumed to be captured by the face value ticket price or made publicly available by the organisers. If the event is subsidised (for example, the building of stadiums) then the full economic cost should also be calculated. Other environmental costs (e.g. waste and habitat destruction) may also be consequential and underpriced, and would ideally also be incorporated.
Step 2 incorporates the climate change costs into the pricing of the event. Even if the event is viable, emissions costs should be paid by those who generate them, both on economic efficiency and equity grounds. We propose direct emissions costs (scope 1 and 2) should be paid by the organisers. The price paid would be the amount of CO2-e multiplied by the SCC, minus any embedded fees already paid (e.g. carbon permits purchased by electricity producers). A mean SCC value is readily available, e.g. the truncated mean from Moore et al.14. Given monopoly power, organisers will likely have the capacity to pass most of these costs on through higher ticket prices52. However, due to the high willingness to pay by consumers this is unlikely to reduce consumer demand. Nonetheless, requiring the producer to internalise their social costs provides an incentive to reduce direct emissions.
Indirect emissions are likely to far outstrip the direct emissions of an event, due to spectator travel. These need to be meaningfully addressed, particularly in the absence of a global transport pricing policy that adequately accounts for the climate costs of aviation, which seems unlikely in the near to medium-term53. Event organisers are not directly responsible for the emissions of spectators. These emissions depend on the travel choices of the spectators themselves. Nonetheless, spectator travel is induced by the event itself. Consumer agency may be limited by a variety of factors, including endogenous preferences and induced demand54,55. These factors highlight the interdependence of consumer and producer decision making, and that neither acts in isolation18,56,57.
We propose that the principle of shared responsibility be applied in allocating the costs of indirect emissions. Shared responsibility is a concept that has been applied in ecological economics58,59, the management of environmental hazards60, and international law61. As noted by Nollkaemper and Jacobs, it applies in situations where “the contributions of each individual cannot be attributed to them based on causation”62. In this context, the principle of shared responsibility is an ethical guiderail that helps to assign the ownership of event emissions – especially indirect (scope 3) emissions.
In the absence of meaningful carbon transport pricing (which is the first best solution), we propose applying the principle of shared responsibility with an insight from welfare economics. That is, to induce behavioural change, measures should be aimed at the activity most closely related to the source of emissions, likely to be distance travelled and mode of transport. While the principle of shared responsibility requires event organisers to own their indirect emissions, it does not require they pay for them at the prevailing SCC. In seeking emissions reduction measures under the principle of shared responsibility, event organisers should engage in a thought experiment where they consider their likely actions if they were deemed to be liable for their direct and indirect emissions at the prevailing SCC (that is, full internalisation of all emissions associated with the event). This would drive organiser decisions around event location and scale. It should also trigger Coasian bargaining between organisers and spectators, as long as transaction costs were low enough. In this scenario, organisers would be willing to pay for low-cost emissions reductions of spectators, potentially funded by higher ticket prices.
Creative solutions to induce climate friendly behaviour change, which could be additive, include: (1) Raising the cost of tickets and offering rebates on proof sustainable travel; (2) Locating events in places that minimise travel (e.g. more venues in regional centres); and (3) Encouraging participants to voluntarily price their carbon using certified offsets and/or charitable donations when other options have been exhausted. A fourth option, which is difficult to quantify but may be impactful, is to utilise the public platform of entertainment events to promote climate focused policies. Each of these solutions has practical limitations which mitigate their effectiveness, but a combination may be successful.
Step 3 involves the collection and allocation of funds. The mechanism for the collection of funds from a carbon pricing policy could be the event organiser itself, who could commission and publicly release an emissions audit. The organiser could then pay the social cost of its direct emissions to a registered charity (similar to the UK’s Single Use Plastic Carrier Bags Charge where retailers directly fund ‘good causes’ from the proceeds). The organiser could also collect part, or all, of the indirect emissions costs through a ticket price-sustainable travel refund scheme. Alternatively, collection could fall to industry associations or to the state (such as in France where the state collects 3.5% of ticket values to support live music63).
The funds generated by a pricing mechanism would be substantial, even if limited to the direct emissions, and should be put to the highest value application. This portfolio of uses could include carbon insetting, research and development, adaptation, and carbon offsets. Allocation of funds could be assisted by an expert panel such as the music industry’s EARTHPERCENT. Alternatively, if the funds raised are collected by the state, the increase in revenue could be used to reduce market-distorting taxes. An essential nuance is that the allocation of collected funds is secondary to the economic rationale of a pricing mechanism, which is to alter behaviour. While we offer this as a complementary list of uses, we note that solutions should be prioritised such that offsets outside of the value chain are a last resort. In other words, solutions should move from the first-best option of altering behaviour via a pricing mechanism, to the second-best solution of reducing emissions elsewhere within the value chain (insetting), to the final option of reducing emissions outside of the value chain (offsetting).
Case studies: 2026 FIFA World Cup and 2024 Coldplay European tour
Having introduced the framework, we will now apply it to two case studies as illustrative examples: the 2026 FIFA World Cup and Coldplay’s 2024 European tour. In doing so, we acknowledge that our back-of-the-envelope estimates contain a number of simplifying assumptions and that the method used for measuring consumer welfare has limitations. Following the structure of our framework, we will first estimate the GHG emissions and associated climate cost, and then secondly assess the welfare impacts.
The selection of these case studies may seem incongruous insofar as they differ in scale. However, these cases are not meant to serve as a direct comparison to one another. Rather, they are intended to illustrate that the methodological framework presented herein can be applied in differing entertainment contexts. Firstly, as the World Cup is a sporting event and the Coldplay tour is a music event, this analysis bridges the gap between the two related industries. Secondly, the World Cup case study is an ex-ante analysis while the Coldplay case is an ex-post analysis. This demonstrates that organisers could implement the framework either in preparation for an upcoming event (ex-ante) or as a review of a previous event (ex-post). The total emissions for both events are presented in Fig. 2.

The Coldplay tour emissions are represented on the lefthand y-axis and the World Cup on the righthand y-axis. A bracket is included to illustrate Coldplay’s relative scale in comparison to the World Cup.
For Coldplay’s tour, we estimate two footprints. First, we assess the tour assuming no measures to reduce emissions. This provides a generalisable, business-as-usual estimate for large-scale tours which do not implement reduction strategies. Second, we consider Coldplay’s reduction efforts (including solar panels, lower-carbon aviation fuels, and incentives for fans to make sustainable travel choices), which cut direct emissions from the band by 59% and audience travel by 48%64. Total unreduced emissions amount to 109.1 kt CO2-e, with virtually 100% of emissions coming from scope 3 sources, in particular audience travel (97%). Within audience travel, air travel generates 80.3 kt CO2-e (74% of total), followed by road travel with 21.5 kt CO2-e (20%) as the second largest contributor. Per-ticket CO2-e emissions are 56.2 kg. In the reduced case, total emissions amount to 58.5 kt CO2-e, representing a 50.6 kt CO2-e (~46%) reduction compared to the estimate without reductions. Still, audience travel accounts for the major share (97%). Using an SCC value of $186 per ton CO2-e, the associated emissions costs for the two footprints are $20.3 m and $10.8 m, respectively.
For the World Cup, we again estimate two footprints to capture the expansion of the tournament from 32 to 48 teams. Resulting estimates for a 32- and 48-team formats are 3.64 mt CO2-e and 4.23 mt CO2-e, respectively. This means that the planned, 48-team tournament will result in approximately 594 kt additional CO2-e being released into the atmosphere compared to the smaller format (~16%). Note that this estimate of 4.23 mt CO2-e is much lower than in an independent report produced by The New Weather Institute (TNWI), who place the tournament at 9.02mt CO2-e6. This is largely driven by a lower assumed air travel rate (57% v. 75%) and the use of updated emissions factors (2025 Department for Energy Security and Net Zero factors are much lower than the 2024 factors used by TNWI)65,66.
Of the 4.23 mt CO2-e projected emissions, roughly 3.07mt are from international travel, with 411,000 t from inter- and intra-city travel, meaning 3.48 mt of total emissions stem from travel (82% of total). Of the remaining 752 kt (18%), 287 kt (7%) are from accommodations, 191 kt (5%) from temporary stadium and facility construction, 78 kt (2%) from food and beverages, and 196 kt (5%) are spread over several minor emissions categories. Approximately 4.12 mt (97%) of total emissions are from scope 3 sources, with less than 1% of emissions being attributed to scope 1 and 2% to scope 2. The associated emissions costs at $186/t CO2-e are $676.3 m for the 32-team tournament and $786.7 m for the 48-team tournament. The additional emissions cost of the tournament’s expansion is $110.4 m.
It is useful to contextualise the magnitude of these events’ GHG emissions: Coldplay’s 109 kt CO2-e is as much as nearly 20,000 Europeans emit in a year67. Triangulating against other live music GHG assessments confirms that Coldplay’s calculated per-ticket emissions are on the high side (e.g. refs. 22,68,69,70). This is likely because Coldplay’s tour attracted fans from across the continent and thus stimulated more air travel than a typical concert. Correspondingly, airports report sizeable increases in passenger volume and flight demand during Coldplay concerts71. Similarly, a spike in travellers to Qatar was recorded during the 2022 World Cup72. For the 2026 World Cup, we estimate that the tournament will result in approximately 3.4 million passenger flights. This amounts to 0.06% of total global air travellers (5.6 billion, projected from 4.4 billion 2023 using 8.4% growth73,74). Determining the additionality of these flights remains challenging, and there is evidence to suggest that mega-event spectators may displace typical tourist travel75. Given this potential for crowding-out, our estimate represents the upper bound of additional emissions caused by the event. Nonetheless, it accurately captures the emissions that can be attributed to the event.
Against this backdrop, Coldplay’s emission reduction represents a noteworthy achievement, almost halving their business-as-usual emissions. This substantial impact was only possible because the band extended mitigation efforts beyond their own operations, which account for merely ~2% of total emissions. A 59% reduction of Coldplay’s direct emissions alone would have translated into a modest ~1% decrease of overall emissions. Instead, a major portion of the reduction (~98%) was achieved through voluntary actions by fans, who collectively reduced their travel-related emissions by 48%.
In comparison to the World Cup, Coldplay’s emissions are rather small: our estimate for the 2026 World Cup of 4.23 mt CO2-e (48 team) is 39x higher than Coldplay’s tour. It is important to note, however, that the World Cup has 104 games while the Coldplay European tour consists of 32 shows: on a per-event basis, emissions are approximately 41,000 t and 3400 t CO2-e, respectively, a difference of about one order of magnitude. This difference is largely explained by differences in flight distances (1500–12,800 km vs. 1100 km), flight rate (57% vs. 10%) and accommodations required (65% vs 34%). Additionally, we have bounded the Coldplay analysis within the 2024 European tour to provide a more discrete event for comparison: it is reasonable to assume that if our inventory were expanded to all 225 Music of the Spheres concerts between 2022 and 2025, emissions would be at least 7x higher, around 760,000 t CO2-e.
The emissions of the World Cup are equal to the yearly emissions of approximately 298,000 Americans, 488,000 Chinese, or 785,000 Europeans – regions which have particularly high per capita emissions67. The average attendee will emit around 1.8 t CO2-e in the 48-team scenario, while the emissions per ticket is equal to roughly 0.6 t CO2-e. 1.8 t is equal to 34% of Europe’s per capita emissions (5.4 t), meaning that the average European World Cup attendee will generate a third of their typical annual emissions attending this event67. For comparison, fan travel over the entirety of the 2018/19 Bundesliga season in Germany (approximately 306 games) was estimated at 370 kt CO2-e, only 11% of the expected travel emissions for the 48-team tournament in North America26. Performing a GHG inventory of these events highlights air transportation as a major driver of emissions for both, with accommodation and construction being secondary drivers of World Cup’s emissions.
The economic surplus of Coldplay’s tour was calculated by comparing observed resale prices with the face value charged by the organiser. The tour sold 1.9 m tickets across 32 concerts. The total face value of these tickets was $232 m, while the aggregated resale market value (WTP) was $1096 m, with an average mark-up per ticket of 372%. Total surplus is estimated to be $987 m, of which $864 m is consumer surplus and $124 m is producer surplus. Total emissions costs (scope 1, 2 & 3) for the unreduced scenario are estimated to be $20.3 m using an SCC of $186/t CO2-e14. These costs are then incorporated into the decision formula: NWe = TSe – ECe. This reveals that Coldplay’s tour generated substantial net benefits: NW remains positive and equals $967 m. Over 32 concerts this implies average net benefits of $30.2 m and welfare losses of $0.6 m per concert. The benefit-to-cost ratio of Coldplay’s tour is around 49:1 for the unreduced emissions scenario, and 91:1 with the emissions reduction.
Notably, there is a wide variation in predicted SCC values within the literature. For robustness, we calculate a ‘break-even’ cost of carbon at which point the event would cease to be climate viable (i.e. NWe = 0). We then contextualise this value by placing it within the distribution of SCC values in a 2025 database compiled by Tol13 ($186/t CO2-e = 54th percentile). For the Coldplay tour, the break-even cost is calculated to be $9045/t CO2-e. This is in the 98th percentile of SCC values13, and is nearly twice the predicted cost of remaining under 1.5 °C of warming50. This reinforces the highly positive net welfare of the Coldplay tour, since it is very unlikely that the emissions cost will be high enough to cancel-out the benefits.
To calculate the total economic surplus associated with the World Cup prior to the event, secondary market ticket prices were collected from several other sporting events. The observed markup rates were then applied to the estimated 2026 World Cup prices to determine willingness to pay. Total surplus is estimated to be $2.15b for a 32-team format and $2.33b for the 48-team tournament (for scope 1, 2, and 3 emissions). This puts the World Cup on par with the economic scale of the Coldplay tour on a per show/match basis at $22 m and $31 m of surplus per event, respectively.
If FIFA were utilising its previous pricing strategy, $1.70b would accrue to the consumer while $452 m would be captured by the producer in the 32-team tournament, while in the 48-team tournament CS would be $2.10b and producer surplus $240 m. However, given FIFA’s increase in pricing, it is likely they will capture most, or all, of the TS (see the methods section and the supplementary discussion). Moving from a 32- to a 48-team format increases overall welfare by around $178 m, excluding environmental externalities. Estimating emissions costs with an SCC value of $186/t CO2-e results in $676 m and $787 m in climate damages for the 32- and 48-team tournaments, respectively. Incorporating these costs into the net welfare equation results in positive NW values of $1.47b and $1.54b. The benefits-to-costs ratios are 3.2:1 and 3.0:1 – much lower than the Coldplay tour.
Increasing the size of the tournament increases net welfare by approximately $67 m, despite adding $110 m in environmental costs. In other words, the additional benefits of increasing the tournament’s size are greater than the additional costs. From this perspective, expanding the World Cup is climate viable insofar as welfare remains positive after accounting for emissions. However, the break-even costs of the two tournament sizes are $591/t CO2-e (32-team) and $550/t CO2-e (48-team). These correspond to the 79th and 78th percentile of the Tol database. In contrast to the Coldplay tour, this finding suggests that a highly carbon-constrained world could render the World Cup unviable. Additionally, the 48-team tournament’s smaller break-even cost and reduced benefits-to-costs ratio illustrates that relative gains diminish as the tournament expands. Even in the central estimate, the costs are very high in absolute terms. The net benefit curves for both events along with the SCC distribution are presented in Fig. 3.

Panel B represents the net benefit curve of the 48 team World Cup. Panel C represents the net benefit curve of the Coldplay European tour. These are plotted against the distribution of SCC values from Tol’s13 database13, excluding observations over $4000/t, shown in Panel A. Several SCC values are highlighted to illustrate potential outcomes under differing scenarios, including the 10th and 90th percentiles of Tol13 as well as the break-even cost of the 48 Team World Cup. It is notable that the World Cup crosses into negative welfare results around 78th percentile of the distribution, which suggests that a heavily carbon constrained world could see the tournament rendered inviable under its current format. All values are in 2025 dollars for a 2025 pulse year.
Pricing mechanisms such as a tax or fee per ton of CO2-e stand out as possible solutions. However, the way in which carbon costs are allocated substantially influences how welfare is distributed. The polluter-pays principle does not completely eliminate ambiguity in the case of entertainment events. Who should pay, the organiser or the spectator? For Coldplay’s tour, if the total carbon costs from all scopes ($20.3 m) are borne by the producer, approximately one sixth (16.4%) of the band’s surplus is eliminated. Assuming that FIFA’s new pricing strategy will capture most of the TS, they would be able to comfortably absorb the total carbon emissions cost of $787 m (all scopes). However, if they were still employing their historical pricing strategy, the emissions costs of the 48-team World Cup ($787 m) exceed FIFA’s surplus ($240 m). Of course, it’s likely that any carbon fee levied on the producer would be passed on to consumers. In this case, emissions costs would reduce the CS of Coldplay’s tour only modestly (around 2.3%). For the World Cup, CS would be reduced by around 38%.
Discussions of a pricing mechanism of this kind may raise concerns about fairness and regressivity. If costs are distributed uniformly across ticket types, each ticket carries the same absolute carbon charge. For Coldplay, this would amount to $11 per ticket, while for the 48-team World Cup it would be $114 per ticket. This results in a higher relative welfare reduction for lower-priced categories, since identical charges represent a larger proportion of their total welfare. For example, in the case of the World Cup, those purchasing category four tickets to the opening match would see their ticket price increase beyond their estimated WTP, as can be seen in Fig. 4 ($122, see supplemental methods Table S12 for full range of estimated WTP). In contrast, allocating costs in proportion to each category’s baseline welfare produces a more balanced distribution of losses. That is, spectators who purchase higher-priced tickets could absorb greater absolute costs, while lower-priced spectators would still have a similar relative cost increase. The latter approach would ensure that environmental costs are internalised in a manner consistent with WTP, preventing regressive outcomes that would disproportionately affect lower-income consumers.

The World Cup is represented in (A) and the Coldplay tour in (B). Consumer surplus is the area between the resale price and the face value price. Total surplus is the area between the resale price and the cheapest face value price. A line of best fit has been plotted to capture the functional form of the face value and resale value pricing: for resale values, this can be seen as tracing the WTP curve. The face value price + SCC assumes that costs are distributed evenly across ticket categories – note that this results in prices that exceed WTP for cheaper ticket categories in the case of the World Cup.
Importantly, across all allocation methods, the inclusion of carbon costs reduces but does not eliminate the substantial net benefits for either event. Taken together, the results demonstrate that integrating carbon costs into entertainment events is both feasible and desirable, but that equitable allocation remains a challenge. As will be discussed, delineating between direct and indirect emissions and applying the principle of shared responsibility can help to achieve this.
‘ The preceding article may include information circulated by third parties ’
‘ Some details of this article were extracted from the following source www.nature.com ’