- If you are wondering whether Six Flags Entertainment is a bargain or a value trap at around US$15.57 per share, this article walks through what the numbers actually say about the stock’s current price.
- The share price is roughly flat year to date with a 0.5% return, but the stock has seen a 11.1% decline over the last 7 days, a 13.8% decline over the last 30 days, and a 55.6% decline over the past year, along with a 64.0% and 67.0% decline over the last 3 and 5 years respectively, which is likely to shape how investors think about both risk and potential recovery.
- These moves come as investors continue to reassess Six Flags Entertainment’s long term prospects and balance what they are willing to pay for the stock after several years of weaker share price performance. Without any major one off headlines driving the latest short term swings, the current price action looks more like an ongoing repricing than a single news driven shock.
- On Simply Wall St’s valuation checklist, Six Flags Entertainment scores 5 out of 6 for being undervalued, giving it a value score of 5/6. Next we will look at the different valuation methods behind that figure before finishing with an even more practical way to think about what the stock might be worth.
Find out why Six Flags Entertainment’s -55.6% return over the last year is lagging behind its peers.
Approach 1: Six Flags Entertainment Discounted Cash Flow (DCF) Analysis
A Discounted Cash Flow, or DCF, model estimates what a company might be worth today by projecting its future cash flows and then discounting those back to a present value.
For Six Flags Entertainment, Simply Wall St uses a 2 Stage Free Cash Flow to Equity model. The latest twelve month free cash flow is a loss of $88.6 million, so the story in this model is very much about what future cash flows could look like rather than what the company is producing today.
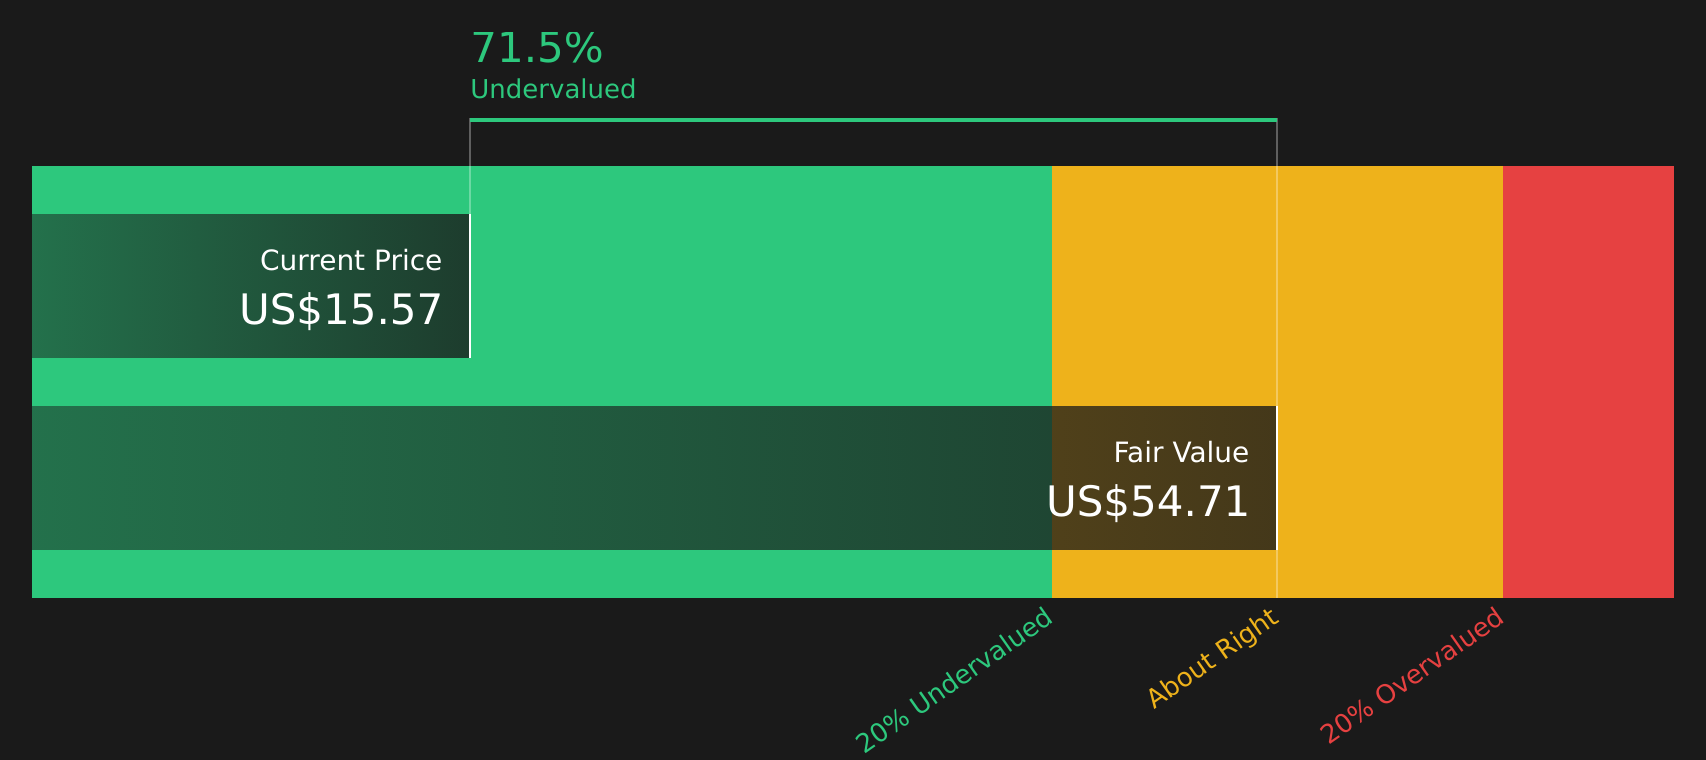
Analysts contribute the near term views, with free cash flow projections in the hundreds of millions of dollars through 2029, and Simply Wall St then extrapolates further years based on those inputs. By discounting each of these future cash flows and adding them together, the model arrives at an estimated intrinsic value of about $54.71 per share.
Compared with a current share price around $15.57, this suggests the stock trades at roughly a 71.5% discount to that DCF estimate. This indicates a wide gap between the market price and this cash flow based valuation.
Result: UNDERVALUED
Our Discounted Cash Flow (DCF) analysis suggests Six Flags Entertainment is undervalued by 71.5%. Track this in your watchlist or portfolio, or discover 47 more high quality undervalued stocks.
Approach 2: Six Flags Entertainment Price vs Sales
For companies where earnings are weak or volatile, the P/S ratio is often more useful because it compares the share price to revenue, which tends to be more stable than profit. Investors usually accept a higher P/S for businesses with stronger growth expectations and lower perceived risk, and a lower P/S for those facing more uncertainty.
Six Flags Entertainment currently trades on a P/S of 0.51x. This sits below the Hospitality industry average P/S of 1.56x and also below the peer average of 1.33x. This indicates that the market is paying less for each dollar of Six Flags Entertainment’s sales than for many comparable companies.
Simply Wall St’s Fair Ratio for Six Flags Entertainment is 0.92x. This is a proprietary estimate of what the P/S might be, given factors such as the company’s growth profile, profit margins, industry, market capitalization and specific risks. It is intended to be a more tailored benchmark than a simple comparison with peers or the broad industry.
With the current 0.51x P/S below the Fair Ratio of 0.92x, the stock screens as undervalued on this metric.
Result: UNDERVALUED

P/S ratios tell one story, but what if the real opportunity lies elsewhere? Start investing in legacies, not executives. Discover our 18 top founder-led companies.
Upgrade Your Decision Making: Choose your Six Flags Entertainment Narrative
Earlier we mentioned that there is an even better way to understand valuation. On Simply Wall St you can use Narratives, which are short, plain English stories that tie your view on Six Flags Entertainment’s future revenue, earnings and margins to a financial forecast. They turn that into a fair value, then compare it with the current price on the Community page, where millions of investors share their views. These Narratives automatically refresh when new earnings or news arrive. You might, for example, align with a more pessimistic fair value of about US$14 based on lower growth and a higher future P/E, or with a more optimistic fair value near US$38 based on stronger margins and a different growth path, and decide for yourself how that story lines up against today’s market price.
For Six Flags Entertainment, however, we’ll make it really easy for you with previews of two leading Six Flags Entertainment Narratives:
🐂 Six Flags Entertainment Bull Case
Fair value in this bullish narrative: about US$38.08 per share
Implied discount to that fair value at US$15.57: roughly 59% undervalued
Revenue growth assumption: about 5.31% a year
- Analysts backing this view expect stronger season pass momentum, better per guest spending through digital tools, and the Saudi Qiddiya park helping long term revenue.
- They factor in higher profit margins supported by cost savings, real estate optimization, and industry consolidation, alongside a discount rate of 12.5%.
- This camp ties its fair value to a lower future P/E than the current US Hospitality industry, with fair value trimmed slightly from roughly US$38.44 to about US$38.08 after updated assumptions.
🐻 Six Flags Entertainment Bear Case
Fair value in this bearish narrative: about US$14.00 per share
Implied premium to that fair value at US$15.57: roughly 11% overvalued
Revenue growth assumption: about 2.93% a year
- Analysts in this camp focus on aging demographics, changing entertainment habits, weather related disruptions, and high debt as ongoing headwinds for attendance, spending, and margins.
- They build in lower profit margins and use a discount rate of about 12.33%, with a higher future P/E multiple balancing weaker profitability in their updated work.
- This view now centers on a fair value of US$14.00, reduced from US$17.00, with the opinion that the market price assumes more optimistic outcomes than these inputs support.
If you want to see how these bullish and bearish storylines are built from the ground up, including the detailed assumptions behind each price target, you can step through both full Narratives on Simply Wall St and decide which version of the future you think is closer to reality.
Curious how numbers become stories that shape markets? Explore Community Narratives
Do you think there’s more to the story for Six Flags Entertainment? Head over to our Community to see what others are saying!

This article by Simply Wall St is general in nature. We provide commentary based on historical data
and analyst forecasts only using an unbiased methodology and our articles are not intended to be financial advice. It does not constitute a recommendation to buy or sell any stock, and does not take account of your objectives, or your
financial situation. We aim to bring you long-term focused analysis driven by fundamental data.
Note that our analysis may not factor in the latest price-sensitive company announcements or qualitative material.
Simply Wall St has no position in any stocks mentioned.
New: Manage All Your Stock Portfolios in One Place
We’ve created the ultimate portfolio companion for stock investors, and it’s free.
• Connect an unlimited number of Portfolios and see your total in one currency
• Be alerted to new Warning Signs or Risks via email or mobile
• Track the Fair Value of your stocks
Have feedback on this article? Concerned about the content? Get in touch with us directly. Alternatively, email [email protected]
‘ The preceding article may include information circulated by third parties ’
‘ Some details of this article were extracted from the following source simplywall.st ’