This article examines whether Melco Resorts & Entertainment is currently priced as a bargain or a value trap by looking at what the numbers indicate about its share price.
The stock last closed at US$6.13, with returns of 10.6% over 1 year, but declines of 7.8% over 7 days, 23.3% over 30 days and 18.4% year to date. These shifts may have influenced how investors view both its potential and its risks.
Recent coverage has described Melco as a Macau focused casino and entertainment operator, highlighting how sector sentiment and regulatory headlines can quickly affect trading in companies like this. That context helps explain the combination of shorter term share price weakness and the stronger 1 year return.
On our valuation checks, Melco scores 4 out of 6 for potential undervaluation, giving it a valuation score of 4/6. Next we will look at how standard metrics such as the P/E ratio and discounted cash flow compare, before finishing with a more complete way to think about what that score represents.
A Discounted Cash Flow, or DCF, model takes projected future cash flows and discounts them back to today to estimate what the business could be worth right now.
For Melco Resorts & Entertainment, the model used is a 2 Stage Free Cash Flow to Equity approach, based on cash flow projections in US$. The latest twelve month free cash flow is about US$190.4 million. Analysts provide forecasts for the next few years, and Simply Wall St extends these with its own estimates, including projected free cash flow of US$1,278.5 million in 2035, with discounted values calculated for each year from 2026 through 2035.
Adding up those discounted cash flows, plus a terminal value, gives an estimated intrinsic value of US$21.61 per share. Compared with the recent share price of US$6.13, the DCF output suggests the stock trades at a 71.6% discount. This indicates that it appears materially undervalued based on this model alone.
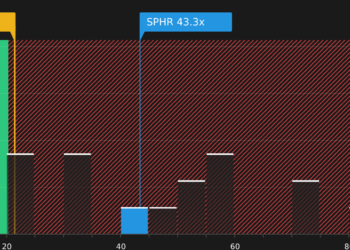
For a profitable company like Melco Resorts & Entertainment, the P/E ratio is a useful way to relate what you pay for each share to the earnings the business is currently generating. Investors usually accept a higher P/E when they expect stronger growth or see lower risk, and a lower P/E when they are more cautious about the outlook or see higher risk.
Melco’s current P/E is 22.99x. That sits close to the Hospitality industry average of 21.89x and below the peer group average of 39.02x, so the share price is not standing out as extremely high or low against broad market references on earnings alone.
Simply Wall St’s Fair Ratio for Melco is 26.86x. This is a proprietary estimate of what a reasonable P/E could be for the company after taking into account factors such as its earnings growth profile, industry, profit margins, market cap and specific risks. Because it adjusts for these company level features, the Fair Ratio can be more tailored than a simple comparison with industry or peer averages.
Comparing the Fair Ratio of 26.86x with the current P/E of 22.99x suggests the shares trade below this tailored reference point, which indicates the stock may be undervalued on this measure.
Earlier we mentioned that there is an even better way to understand valuation, so let us introduce you to Narratives.
A Narrative is simply your story about a company, written in numbers, where you set your own view of fair value and your assumptions for future revenue, earnings and margins instead of relying only on one fixed model.
This story then links directly into a forecast and a fair value estimate that you can compare with the current share price. This can help you decide whether you see Melco Resorts & Entertainment as attractively priced or as something to avoid right now.
On Simply Wall St, Narratives sit inside the Community page, are easy to create and update, and are used by millions of investors. Fair values can change automatically when fresh information such as new earnings or news is incorporated into their assumptions.
For Melco Resorts & Entertainment, one investor might plug in cautious revenue and margin assumptions and arrive at a much lower fair value than another investor who assumes stronger future operating performance and a higher valuation multiple.
This article by Simply Wall St is general in nature. We provide commentary based on historical data and analyst forecasts only using an unbiased methodology and our articles are not intended to be financial advice. It does not constitute a recommendation to buy or sell any stock, and does not take account of your objectives, or your financial situation. We aim to bring you long-term focused analysis driven by fundamental data. Note that our analysis may not factor in the latest price-sensitive company announcements or qualitative material. Simply Wall St has no position in any stocks mentioned.