If you are wondering whether Six Flags Entertainment is a bargain or a value trap at its recent price of US$18.01, this article will walk you through how the market is currently pricing the stock and what that might mean for you.
The share price return sits at 1.6% over the last 7 days and 16.3% over the last 30 days and year to date, while the 1-year return is a 59.4% decline. The 3-year and 5-year returns are 57.3% and 57.0% declines respectively.
Recent news around Six Flags Entertainment has focused on its position within the consumer services space and investor reactions to the stock’s longer term share price record. Together, this context helps explain why short-term gains sit alongside much weaker multi-year returns.
Simply Wall St’s valuation model currently gives Six Flags Entertainment a 5 out of 6 valuation score. This suggests most of its checks point to the shares looking undervalued. Next, we will look at how different valuation approaches reach that view before finishing with a more rounded way to think about the company’s value.
A Discounted Cash Flow model takes projected future cash flows and discounts them back to what they are worth today using a required return. It is essentially asking what you would pay now for the cash the business is expected to generate in the future.
For Six Flags Entertainment, the latest twelve month free cash flow is a loss of $93.6 million. The current model uses a 2 Stage Free Cash Flow to Equity approach, with analyst estimates up to 2029 and further years extrapolated. For example, projected free cash flow in 2029 is $547 million, and the ten year path includes discounted estimates such as $239.1 million in 2026 and $341.5 million in 2029.
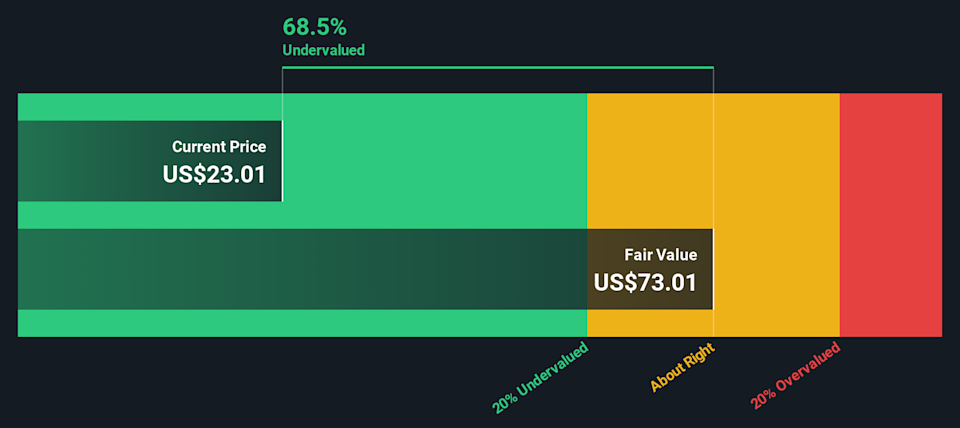
Aggregating these discounted cash flows gives an estimated intrinsic value of US$58.50 per share. Compared with the recent share price of US$18.01, the model implies a 69.2% discount, which indicates that the shares are trading well below this DCF estimate.
For companies where earnings are volatile or negative, price based on sales can often be more useful than profit-based measures. The P/S ratio compares the value the market places on the company with the revenue it is generating, which can be easier to interpret when profits are not yet stable.
In general, investors tend to accept a higher or lower P/S ratio depending on their expectations for future growth and how risky they believe the business is. Higher growth and lower perceived risk can support a higher P/S multiple, while slower growth or higher risk usually point to a lower one being more reasonable.
Six Flags Entertainment currently trades on a P/S ratio of 0.58x, compared with the Hospitality industry average of 1.61x and a peer average of 1.17x. Simply Wall St also calculates a proprietary “Fair Ratio” for the company of 0.99x. This measure aims to reflect the P/S multiple you might expect given factors such as earnings growth, profit margins, industry, market cap and specific risks, rather than relying only on broad peer or industry comparisons.
The current P/S of 0.58x sits below the Fair Ratio of 0.99x, which indicates that the shares may appear undervalued on this metric.
Earlier we mentioned that there is an even better way to understand valuation, so let us introduce you to Narratives, a simple way to connect your view of a company with the numbers behind it. A Narrative is your story about Six Flags Entertainment, captured as assumptions about future revenue, earnings and margins, which then flow through to a forecast and a fair value estimate. On Simply Wall St, millions of investors use Narratives on the Community page to set out their views and see how their fair value compares with the current share price. This helps you decide whether Six Flags Entertainment looks attractive, fairly priced or expensive, based on your own inputs rather than a single fixed model. Narratives update automatically when new information such as earnings releases or news becomes available, so your fair value view can stay aligned with what is happening. For example, one Six Flags Entertainment Narrative might assume a relatively low fair value and modest revenue growth, while another assumes a higher fair value and stronger growth, showing how different investors can reasonably disagree yet still use the same tool.
This article by Simply Wall St is general in nature. We provide commentary based on historical data and analyst forecasts only using an unbiased methodology and our articles are not intended to be financial advice. It does not constitute a recommendation to buy or sell any stock, and does not take account of your objectives, or your financial situation. We aim to bring you long-term focused analysis driven by fundamental data. Note that our analysis may not factor in the latest price-sensitive company announcements or qualitative material. Simply Wall St has no position in any stocks mentioned.