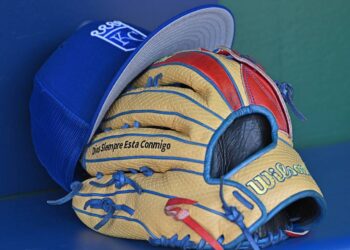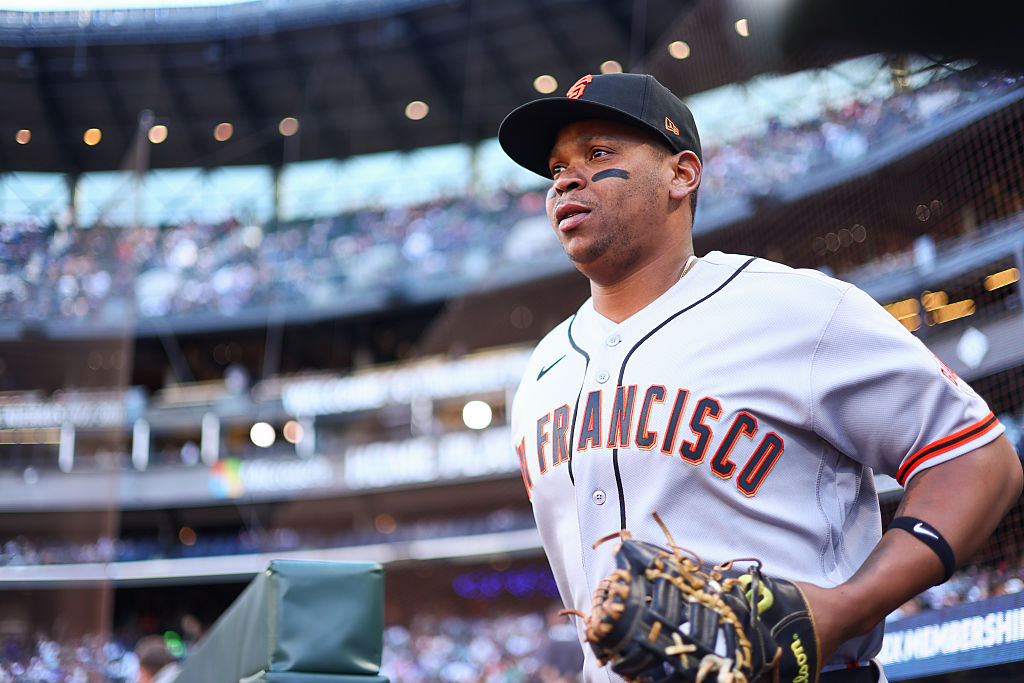
Looking for today’s Kansas City Royals vs. San Francisco Giants betting splits? Below you’ll find the latest DraftKings Sportsbook betting percentages, including Moneyline, Run Line and total splits, plus where the public is betting, where larger wagers may indicate sharp money, and key matchup stats before first pitch.
Royals vs. Giants Odds
| Market | KC Royals | SF Giants |
|---|---|---|
| Moneyline | -107 | -112 |
| Run Line | +1.5 (-176) | -1.5 (+145) |
| Total | O/U 9.5 (Over -114 / Under -105) | |
DraftKings Betting Splits
| Market | Side | Handle % | Bets % |
|---|---|---|---|
| Moneyline | KC Royals | 49% | 45% |
| Moneyline | SF Giants | 51% | 55% |
| Run Line | KC Royals +1.5 | 5% | 67% |
| Run Line | SF Giants -1.5 | 95% | 33% |
| Total | Over 9.5 | 86% | 30% |
| Total | Under 9.5 | 14% | 70% |
Public Betting Trends
The Moneyline market is fairly balanced, with 55% of tickets on the Giants and 51% of the handle following suit. Neither side is drawing an outsized share of money relative to ticket count, making this a true coin-flip from a public-action perspective.
The Run Line tells a different story. While 67% of individual bets back the Royals at +1.5, a staggering 95% of the handle sits on the Giants -1.5. That kind of handle-to-ticket divergence is a classic sharp-money signal. Larger bettors appear confident San Francisco wins by two or more runs.
On the total, the public is heavily backing the Under at 70% of tickets. Yet 86% of the money wagered has landed on the Over 9.5. This is another textbook sharp-versus-public split: recreational bettors see two weak pitchers and still lean Under, while sharps are loading up on the Over at -114.
Royals vs. Giants Stats
Team Batting Stats
| Stat | KC Royals | SF Giants |
|---|---|---|
| AVG | .248 | .254 |
| OBP | .316 | .308 |
| SLG | .399 | .418 |
| OPS | .715 | .726 |
| ISO | .151 | .164 |
| K% | 21.3% | 21.0% |
| BB% | 8.2% | 6.3% |
| Runs | 430 | 411 |
Starting Pitcher Stats
| Stat | Luinder Avila (KC) | Tyler Mahle (SF) |
|---|---|---|
| Record | 4-3 | 2-8 |
| ERA | 5.08 | 5.31 |
| WHIP | 1.62 | 1.46 |
| FIP | 4.56 | 4.46 |
| xFIP | 4.82 | 4.21 |
| K/9 | 7.94 | 8.42 |
| HR/9 | 0.95 | 1.39 |
| K% | 20.2% | 21.7% |
| BB% | 13.7% | 9.5% |
| Starts | 9 | 15 |
Team Pitching Stats
| Stat | KC Royals | SF Giants |
|---|---|---|
| ERA | 4.97 | 4.40 |
| WHIP | 1.45 | 1.35 |
| K/9 | 7.73 | 7.73 |
| K/BB | 1.98 | 2.04 |
| OBA | .265 | .247 |
Key Matchup Numbers
- Struggling starters fuel Over: Both starters own ERAs above 5.00 with a combined 1.54 WHIP average, supporting the O/U 9.5 total and the sharp lean toward the Over.
- Avila’s walk problem: Avila’s 13.7% walk rate is the highest among qualified KC starters this season, giving Giants hitters extra base runners without needing to put the bat on the ball.
- Mahle’s mixed peripherals: Mahle’s xFIP (4.21) sits well below his ERA (5.31), suggesting some bad luck or sequencing. His strikeout rate (21.7%) is solid, but a 1.39 HR/9 makes him vulnerable in Kauffman Stadium’s hitter-friendly summer conditions (85 degrees, 11 mph wind NNE).
- Offense and plate discipline: The Giants hold a .726 OPS vs. Kansas City’s .715, but KC draws walks at a notably higher clip (8.2% vs. 6.3%), which could extend innings against a wild starter like Avila is not.
- Road and home records: Kansas City is 24-27 at home, while San Francisco is 20-33 on the road. Both clubs sit on losing streaks of context: KC snapped theirs with a W1 streak, while SF enters on an L3 slide.
With two pitchers who struggle to limit damage, the sharp-money indicators on the Over and on SF -1.5 suggest larger bettors see the Giants’ slightly superior pitching staff (4.40 ERA vs. 4.97) containing runs just enough to win comfortably, while both offenses combine for double-digit scoring potential.
Betting Splits Summary
| Category | Public Side | Sharp Indicator |
|---|---|---|
| Moneyline | SF Giants (55% bets) | Balanced (51% handle) |
| Run Line | KC Royals +1.5 (67% bets) | SF Giants -1.5 (95% handle) |
| Total | Under 9.5 (70% bets) | Over 9.5 (86% handle) |
FAQs
What are betting splits?
Betting splits show the percentage of bets (tickets) and handle (money wagered) on each side of a market. They help identify where the public and sharper bettors are positioned.
What is the difference between bets and handle?
Bets refer to the number of individual wagers placed on a given side. Handle is the total dollar amount wagered. A gap between the two can reveal where larger, potentially sharper wagers are concentrated.
What does sharp money mean?
Sharp money refers to wagers placed by professional or highly informed bettors. When a small percentage of tickets accounts for a large share of the handle, it often signals sharp action on that side.
What is the Run Line in baseball betting?
The Run Line is baseball’s version of the point spread, typically set at 1.5 runs. The favorite must win by 2 or more runs to cover -1.5, while the underdog can lose by 1 run and still cover +1.5.
How should I use betting splits to inform my wagers?
Betting splits are one data point among many. Large handle-to-ticket divergences can indicate sharp positioning, but they work best when combined with matchup analysis, pitching stats, and situational factors like weather and injuries.
‘ The preceding article may include information circulated by third parties ’
‘ Some details of this article were extracted from the following source dknetwork.draftkings.com ’