Let’s start with the good news. What types of news stories are most likely to make a reader subscribe on a local newspaper’s website? Is it celebrity news, horoscopes, sports scores, the gardening column? Nope — it’s hard news. Local government, public health, politics — the sort of stuff that makes for a healthy democracy. Those stories are much more likely to turn a reader into a subscriber than the softer stuff.
The bad news? Even those hard news stories don’t convert enough readers to sustain the cost of producing them.
Those findings come out of one of the most remarkable bits of journalism research I’ve ever read — a granular analysis of a newspaper’s web traffic at a scale we’ve never seen before. We’re talking more than 1.2 billion user sessions, covering more than 600 million individual article visits, all of them tied to unique user profiles, over a four-year period. Researchers were able to track each reader’s path — how often they visited, what types of articles drew their attention, and what they did each time they were confronted with a paywall and a decision: offer up a credit card or go find something else to read online.
“I think, at least among people who study communication, the conventional wisdom is that most people are interested in entertainment and sports, only incidentally exposed to politics coverage at all — they don’t really seek it out,” said Gregory J. Martin of Stanford University, the paper’s lead author. “If they get it at all, it’s by accident. That, I think, is kind of the conventional wisdom, both among scholars of journalism as well as among people who actually run newspapers.
“Our paper is making the point that that is basically true — if you look at visits. Those are the sort of articles that generate the most traffic. But willingness to pay in attention is really different than willingness to pay in dollars.”
The paper’s title echoes a century’s worth of publisher audience surveys — “What do news readers want?” and it’s by Martin, Shoshana Vasserman, and Cameron Pfiffer. (Vasserman’s also at Stanford; Pfiffer now describes himself as a “recovering financial economist.”)
The researchers’ data comes from a single newspaper, which they have anonymized here. It’s described only as a “metropolitan daily newspaper headquartered in a large U.S. city,” with the additional detail that it is “currently owned by a private-equity-controlled holding company.” So it’s probably a reasonable guess that it’s a paper owned by Alden Global Capital (MediaNews Group, Tribune Publishing) or Chatham Asset Management (McClatchy). Digital subscriptions account for only about 40% of the paper’s total subscribers, the remainder still in print — but of course print has done nothing but dwindle for many, many years.
Online, the paper has your standard metered paywall, one whose boundaries have varied over time — five articles every 30 days, three articles every 60 days, and so on. Whenever a user hit those boundaries, a paywall would appear, offering a cheap intro rate to subscribe and keep reading. The data researchers had about these readers’ behavior was extremely rich. (Creepily rich, for people with certain views about digital privacy — though of course it was all anonymized for research purposes.) How deep they read into each individual article; how many words (estimated) they had consumed in the previous six weeks; how many times they’d bumped into a paywall and bounced right off.
On the flip side, they had rich data on the articles themselves and who produced them. Stories were divided up via content analysis into eight distinct “beats”: Sports, Entertainment, Local News, Health, Business, Local Events, Editorial, and Crime. They tracked whether stories mentioned at least one local place name. Staff-written articles were separated from wire stories. Pieces were also categorized based on whether they met eight “Community Information Needs” as defined through an FCC report (things like Emergencies and Public Safety, Environment and Planning, Economic Development, and Civic Life) as well as six others researchers defined (like Real Estate, Things to Do, and Opinion Columns).
Each story was tied to the reporter(s) who produced it, tracking their relative frequency of publication. And stories were flagged as being “investigative” or not using a creative measure that looked at how much an individual story influenced future coverage of the same subject. (I think “important” might be a better term for what they’re measuring than “investigative,” but that’s a quibble.)
They also divided all of the site’s non-subscribers, based on their behavior, into three different “bins,” ranging from casual, one-off readers to those eager enough to bump into paywalls regularly. (“Bin 3 users are more than 100 times as likely to subscribe as those in bin 1, conditional on encountering a paywall.”)
Basically, they had near god-like visibility into the content this newspaper produced, all the ways readers consumed it, and the intersections in between. Let’s go through some of the most interesting findings.
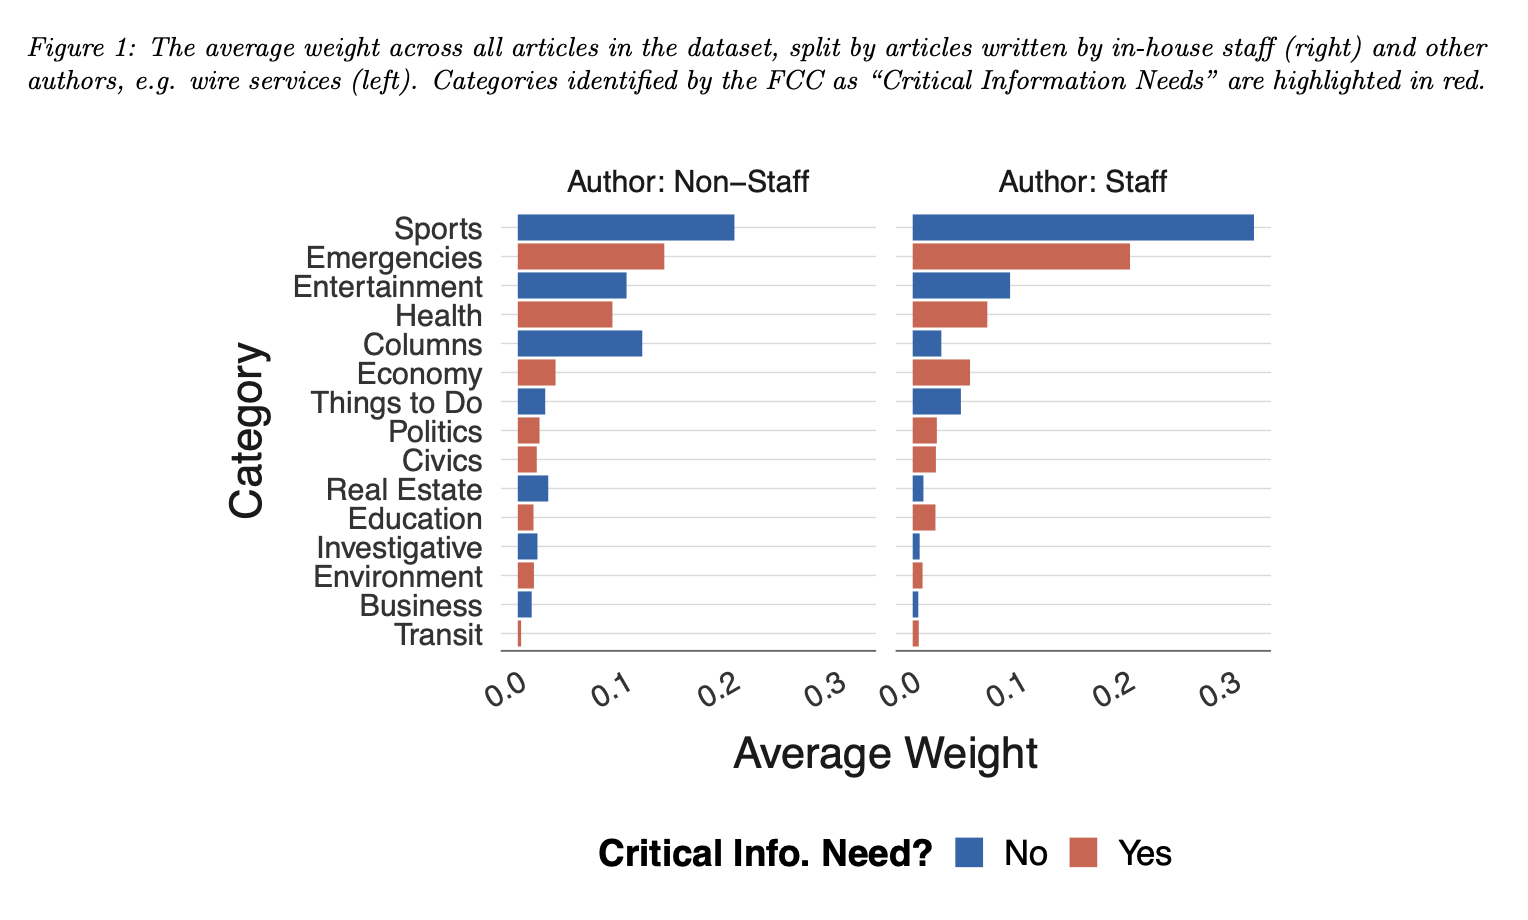
First of all, this paper loved to cover sports. When articles are broken down by the “information needs” they meet, Sports is far and away No. 1 in both staff-written and non-staff content. The only other “information need” near it among staff articles is “Emergencies and Public Safety” — which overwhelmingly means crime stories.
But what happens when you look at how those information needs aligned with the two output metrics the authors are measuring — how many visits they generate and how many subscriptions they generate? The somewhat confusing chart below is actually two charts — non-staff articles on the left and staff articles on the right. Each point on the chart represents how much value those articles offered in terms of visits (x-axis) and subscriptions (y-axis) compared to the site’s average.

In the bottom left, you can see that non-staff articles are all below average in both visits and subscriptions — with the single exception of columns, which are a big winner in visits but still a loser for subscriptions. (Think advice columns or syndicated opinion columnists.)
Meanwhile, among staff-written articles, the “hard news” article types — marked in red — fared better in both visits and subscriptions than the “soft news” types marked in blue.
(This is as good a place as any to note that huge outlier in the upper right — health stories. This analysis covers January 2020 to December 2023 — which means it includes an enormous number of Covid stories, which drove enormous reader interest, including a boomlet in subscriptions. So the fact that health stories look wildly more successful than anything else the newspaper produces is in large part an artifact of the pandemic. Martin told me that, if you only look at the later years of the study period, health stories still performed well — just not as absurdly better than every other type of story. Still, if you wanted to get someone to convert someone from casual reader to subscriber, there has basically never been a tool as effective as putting a Covid article behind the paywall circa 2020.)
Here’s how each beat contributed on visits and subscriptions within each of the three user bins they’ve defined. (Bin 1 is casual readers who will basically never subscribe. Bins 2 and 3 are each increasingly more frequent and dedicated readers.)

Unsurprisingly given the subscription rates, Bin 1 subscription utilities are uniformly much lower than the other two reader types. For the higher-propensity bins, however, hard news beats like Business, Health and Local News…generally outperform the soft news beats like Entertainment and Sports. Almost all in-house beats outperform wire-sourced articles on both dimensions for Bins 2 and 3. For Bin 1, wire-sourced articles are at the bottom in traffic generation but average in subscription utility.
“Even for people who, most of the time in their past history, read sports and weather articles and things like that, their potential to subscribe was still higher when they encountered a paywall on a story about politics, or about public health, or about one of our other hard news topics,” Martin told me. “So I don’t think it’s just that it’s a different person who is on the margin of subscribing versus visiting…People are able to recognize what’s valuable, and that’s different from what they’re willing to click on to read.”
Martin et al. then engage in a bit of fantasy-sports-for-newsrooms. If you wanted to optimize your newsroom for web traffic or for digital subscriptions, how would you allocate your resources? Which beats would you devote more reporters to, and which ones would you cover less?
Assuming that overall headcount remained constant, the researchers say that reducing coverage of crime would improve both visits and subscriptions. Increasing coverage of health would do the same — though note the caveat above about the uniqueness of Covid. For other beats, though, chasing visits and chasing subs point in opposite directions. Add more entertainment reporters? You’ll increase visits but reduce subscriptions. Add more local news reporters? You’ll decrease visits but increase subscriptions.


All of that sounds like good news for those of us who would like local newspapers to protect its most civically useful beats — the “iron core” of journalism — whenever there’s another round of cuts to be had. If your newsroom still lives and dies by Chartbeat — if pageviews are all that matters to management — it’s missing out on some critical intel. The stories that get visits might be the ones you should be doing fewer of if your goal is chasing subscriptions. Smarter newsrooms have known this, at least intellectually, for a while, of course. But here’s hard data proving it.
But what about that bad news? Because Martin et al. have all this data tying reporters to stories to visits to subscriptions, they also have a go at testing whether hiring an additional journalist might even pay for itself. If more local news means more digital subscriptions, could we be at a point where a reporter’s salary might be covered by the extra subscriptions that her work generated? If that were true, it’d be an excellent case for further investment in newsroom capacity.
Unfortunately…it’s not. Even in the most optimistic scenarios, the authors find, one reporter’s digital subscriptions don’t come close to paying one reporter’s salary.
Here’s a chart showing the relative share of a marginal reporter’s salary covered by marginal digital sub revenue. (Note that the researchers don’t have access to this newspaper’s reporters’ actual salaries; they’re using market averages.) Adding a local news reporter will generate digital subscriptions all right — but only enough to cover something like 1/4 of their salary. Even during peak Covid, a health reporter’s digital subs would only cover around 60% or so of their salary.

To be fair, Martin notes that this methodology only accounts for the digital subscription revenue that an individual reporter might generate. Newspapers make money in other ways — from print (somehow!) and from online ads (theoretically!). But neither of those is going in the right direction, and the connection between an individual reporter’s work and revenue is much more abstract. “In a world where newspapers were exclusively online, for the staff, the digital subscriptions alone wouldn’t have covered the the cost, at least during this period,” Martin told me.
So that’s the paper’s central conundrum. If a newsroom wants to optimize for digital subscriptions — which for more than a decade has been the closest approximation of a sustainable business model for high-quality local news — it should lean into hard news. But no matter how hard it leans, the underlying numbers remain dangerously unstable.
‘ The preceding article may include information circulated by third parties ’
‘ Some details of this article were extracted from the following source www.niemanlab.org ’