- Wondering whether Live Nation Entertainment at around US$167.50 is priced for perfection or still offers room for value is a fair question for any investor looking at the stock today.
- Recent returns, including 2.0% over the past week, 2.8% over the past month, 15.3% year to date and 16.7% over the last year, along with a 92.4% three year return and 92.0% five year return, show how much sentiment on the stock has shifted over different time frames.
- Recent news coverage has focused on Live Nation Entertainment’s position in the live events industry and regulatory attention around ticketing and market structure, which can influence how investors think about future cash flows and risk. At the same time, ongoing commentary about consumer demand for live experiences provides context for why the stock’s performance attracts so much scrutiny.
- On Simply Wall St’s 6 point valuation checklist, Live Nation Entertainment currently scores a 3. The sections ahead will walk through what that means across different valuation methods and point you toward a more complete way of thinking about value by the end of the article.
Approach 1: Live Nation Entertainment Discounted Cash Flow (DCF) Analysis
A Discounted Cash Flow, or DCF, model takes projected future cash flows and discounts them back into today’s dollars. This aims to show what the business could be worth based on those cash flows rather than current market mood.
For Live Nation Entertainment, the latest twelve month Free Cash Flow is about $1.56b. Analysts provide explicit forecasts for the next few years. Simply Wall St then extrapolates further out using a 2 Stage Free Cash Flow to Equity model. Under this approach, projected Free Cash Flow for 2030 is $2.71b, with intermediate annual projections between 2026 and 2035 discounted back to today.
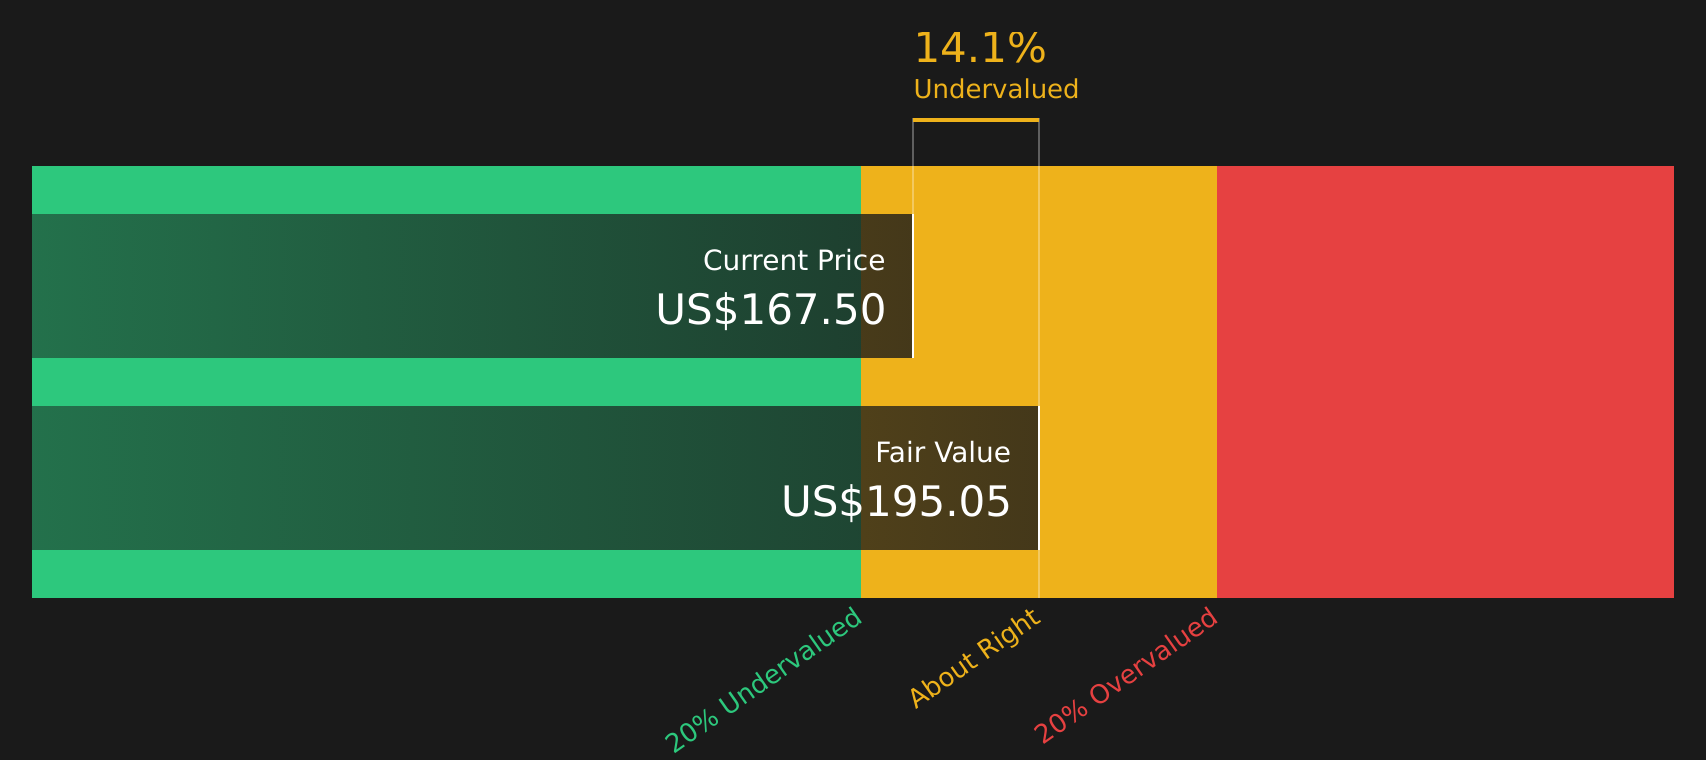
Putting all of those discounted cash flows together, the model arrives at an estimated intrinsic value of $195.05 per share. Against a current share price of about $167.50, the DCF output implies the stock trades at roughly a 14.1% discount to that estimate. This indicates that Live Nation Entertainment appears undervalued on this specific cash flow based view.
Result: UNDERVALUED
Our Discounted Cash Flow (DCF) analysis suggests Live Nation Entertainment is undervalued by 14.1%. Track this in your watchlist or portfolio, or discover 47 more high quality undervalued stocks.
Approach 2: Live Nation Entertainment Price vs Sales
For profitable companies where earnings can be volatile, the P/S ratio can be a useful way to compare what investors are paying for each dollar of revenue, especially in sectors where margins can swing with the cycle.
In general, higher growth expectations and lower perceived risk tend to justify a higher “normal” or “fair” multiple, while slower growth or higher risk usually point to a lower multiple being reasonable.
Live Nation Entertainment currently trades at a P/S ratio of 1.52x. That sits above the Entertainment industry average of 1.24x but below the peer group average of 3.47x. This already gives mixed signals about how the stock is being valued.
Simply Wall St’s Fair Ratio for Live Nation Entertainment is 2.06x. This is a proprietary estimate of what the P/S ratio might be, given factors such as the company’s earnings profile, industry, profit margin, market cap and specific risks.
Comparing a stock only with peers or industry averages can miss these nuances. The Fair Ratio instead aims to adjust for growth, risk, profitability, industry and size in one number.
Since the current P/S of 1.52x is below the Fair Ratio of 2.06x, the stock appears undervalued on this metric.
Result: UNDERVALUED

P/S ratios tell one story, but what if the real opportunity lies elsewhere? Start investing in legacies, not executives. Discover our 19 top founder-led companies.
Upgrade Your Decision Making: Choose your Live Nation Entertainment Narrative
Earlier it was mentioned that there is an even better way to understand valuation, and on Simply Wall St that comes through Narratives. You choose a story for Live Nation Entertainment that reflects your view on its future revenue, earnings and margins, then link that story to a financial forecast and a fair value. You can then compare that fair value with the current price to help decide whether to buy, hold or sell. This is all done within an easy Community tool that updates automatically as new earnings or news arrive. One investor might back a higher fair value that aligns with assumptions similar to the US$206.0 bullish analyst target, while another might anchor closer to the US$145.0 bearish target. Both perspectives can sit side by side and adjust over time as the facts change.
Do you think there’s more to the story for Live Nation Entertainment? Head over to our Community to see what others are saying!

This article by Simply Wall St is general in nature. We provide commentary based on historical data
and analyst forecasts only using an unbiased methodology and our articles are not intended to be financial advice. It does not constitute a recommendation to buy or sell any stock, and does not take account of your objectives, or your
financial situation. We aim to bring you long-term focused analysis driven by fundamental data.
Note that our analysis may not factor in the latest price-sensitive company announcements or qualitative material.
Simply Wall St has no position in any stocks mentioned.
New: AI Stock Screener & Alerts
Our new AI Stock Screener scans the market every day to uncover opportunities.
• Dividend Powerhouses (3%+ Yield)
• Undervalued Small Caps with Insider Buying
• High growth Tech and AI Companies
Or build your own from over 50 metrics.
Have feedback on this article? Concerned about the content? Get in touch with us directly. Alternatively, email [email protected]
‘ The preceding article may include information circulated by third parties ’
‘ Some details of this article were extracted from the following source simplywall.st ’