
As a Madison layperson, trying to figure out weather patterns can be challenging. It feels like it rained a lot last year — did it? How cold are Madison winters? Is it getting progressively windier every year?
Amanda Latham, a climate outreach specialist for the Wisconsin State Climatology Office, has the data on hand to answer all sorts of weather queries.
Take November’s weird weather — temperatures started in the 30s and reached the high 60s in the middle of the month before Madison was hit with historic amounts of snow around Thanksgiving. Nov. 29 was the snowiest November day on record, Latham said. The month was the third-snowiest November to date.
In February 2024, fishing enthusiasts still came out to the lakes despite warmer temperatures on Monona Bay.
The Cap Times asked Latham even more weather questions, compiled from popular Google search queries about Madison weather and a few nagging questions on our end.
For more historic data about Wisconsin weather, seasons, snowfall, rain and more, visit climatology.nelson.wisc.edu.
Are winters harsh in Madison?
Latham said “harsh” is a difficult metric to quantify, and that one’s measure of harshness is subjective. But “compared to other places in the state, in northern states, in parts of Michigan, Minnesota — not quite as harsh as those areas,” she said.
Madison averages about 52 inches of snow every winter, and Latham pulled data to identify years where snowfall deviated drastically from those averages. During the 2007-2008 winter, Madison got 101.4 inches of snow, the snowiest winter on record (she also noted that the season had a weak La Niña, a weather pattern that can influence global conditions).
Weak La Niñas have historically led to more snow in Wisconsin. This year, she said, is another weak La Niña — considering Madison has already received 19.8 inches, this could be another year the city gets higher-than-average snow.
On the flip side, last year, the 2024-25 season, was Madison’s 10th least-snowy winter on record. The city received only 22.1 inches, tying the 1960-61 season. The least snowy season? The winter of 1901-02, when Madison only got four inches of snow.
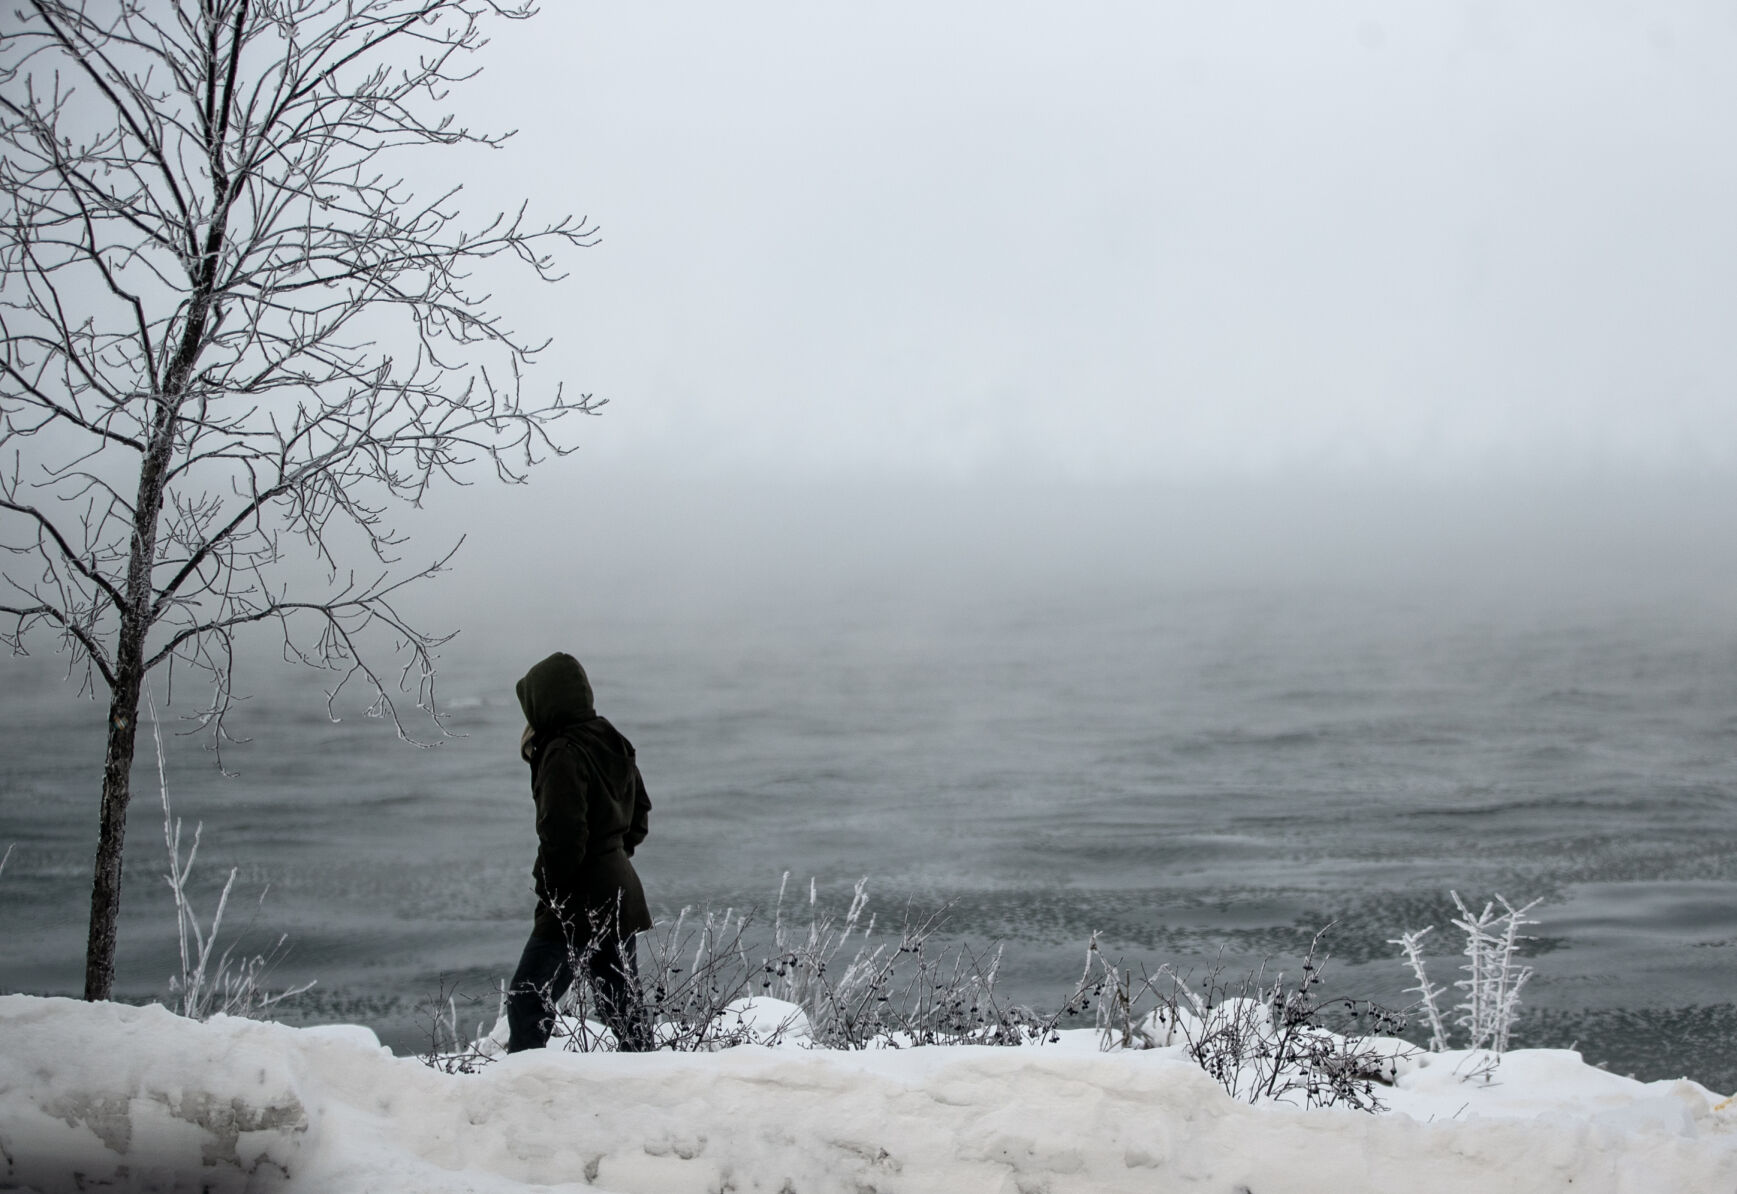
A person walks along the Howard Temin Lakeshore Path in sub-zero temperatures in this archive image from 2022.
How cold does it get in Madison?
Average winter temperatures hover around the 20s and 30s. November’s average temperature is 36.7 degrees Fahrenheit, while February hovers at 23 degrees. Latham said January typically is the coldest month of the year with “an average high of 27 degrees Fahrenheit and an average low of 11.8.” The average monthly temperature is 19.4 degrees Fahrenheit.
Madison’s coldest winter was 1976-77 (also the second snowiest), followed by 1962-63.
The coldest day on record happened on Jan. 30, 1951, when temperatures dropped to -37. In a given winter, “Madison typically sees temperatures drop below zero 14 times each year and about four days with high temperatures in the single digits,” Latham said.
Toward the end of January is the time to stay bundled up. “The coldest conditions typically occur between Jan. 21 to 31,” Latham noted.
But there are days when it can feel even colder, Latham found in compiling the data.
“The city’s coldest wind chill (feels-like temperature) of winter is usually around -30 degrees Fahrenheit. Madison spends an average of 51 hours per winter with a wind chill of -20 or colder.”

Kelsey Sorum bundles up for an afternoon walk on the near east side.
What is the hottest month in Madison?
July is the hottest month in Madison, with an average temperature of 71.9 degrees Fahrenheit. The average high is 82.1; the average low is 61.6.
The hottest stretches occur between July 11 and 31, Latham said, with the hottest day on record occurring on July 14, 1936 — it was 107 degrees Fahrenheit.
Scorching hot days aren’t uncommon in the summer months. “Madison typically sees about eight to nine 90-degree days each summer,” Latham said.

This archive image from February 2024 shows wreckage from a tornado in Edgerton. Southern Wisconsin — specifically, Dane County — has seen significantly more tornadoes than northern Wisconsin.
Are tornadoes common in Madison?
Latham said that Wisconsin averages 23 tornadoes each year. “Thirty-nine tornadoes have occurred in the state in 2025, making it the 6th most since 1950.” Data showed that 2005 had the most tornadoes with 63.
A map from the State Climatology Office tracking tornado occurrences by county from 1950 to 2024 showed that southern Wisconsin — specifically, Dane County — has seen significantly more tornadoes than northern Wisconsin.

But those numbers might also be influenced by how tornadoes are quantified. “Before the 1990s, when there was no radar, tornadoes were usually reported based on sightings or by damage,” Latham said.
One would expect to hear about a tornado in more heavily populated parts of the state. Latham noted that “If there was no one around to see a tornado in a forest in Iron County, it may have been overlooked!”
How long is summer in Madison?
Latham said her office has noticed the last frost of spring is happening earlier, fall’s first frost is happening later and summer is getting longer in Madison.
“Our springs are getting shorter and our fall seasons are getting shorter. … We’re seeing hot temperatures lasting later in the fall, and then the last freezes of spring are happening sooner,” she said.
The last frost is happening a week or two earlier, she said, with the first frost shifting from early October to mid-October. She said this information helps farmers figure out when they can get into their fields.
A longer summer might seem glorious, but with a longer summer comes more bugs.
“Pests are coming out a little bit sooner in the spring, and then they’re lasting a bit longer in the fall as well,” Latham said.

A kiteboarder in April 2020 enjoys a windy day. Tracking wind patterns is challenging, according to a Wisconsin climatologist.
Is it getting windier in Madison?
Latham assured the Cap Times that this was not a silly question to ask. “We get that question so frequently,” she said. Like tornadoes, tracking wind patterns is challenging.
Anemometers measure wind speed, and Latham said the standard height at which an anemometer should be located “has changed throughout the years, which means you’re measuring wind speeds in different parts of the atmosphere.”
Also, measurements can be affected by obstructions, such as trees, which grow over time, further complicating readings.
“Just looking at the raw data, it shows that we’re getting less windy. But then everyone is saying, like, ‘Oh, it feels like we’re getting so much windier,’” Latham said.
She said that’s a challenge climatologists are facing now. “We’re trying to figure out how to look at the data while factoring in the height changes.”
‘ The preceding article may include information circulated by third parties ’
‘ Some details of this article were extracted from the following source captimes.com ’