- If you are wondering whether Caesars Entertainment at around US$27.38 is a bargain or a value trap, the starting point is understanding what the current price actually reflects.
- The stock has returned 7.4% over the past month and 16.2% year to date, although the 1 year return is 1.2% and the 3 and 5 year returns are negative at 37.8% and 73.4% respectively, which can change how investors think about both upside potential and risk.
- Recent headlines have focused on Caesars Entertainment’s positioning within the broader hospitality and gaming space and how management is responding to changing consumer patterns and competitive pressures. This context helps frame why the share price has been relatively flat over 7 days at a 0.4% decline even as the year to date move is positive.
- On Simply Wall St’s valuation checks, Caesars Entertainment scores a perfect 6 out of 6. This calls for a closer look at how different valuation approaches line up and how investors might go a step further by focusing on the quality of the assumptions behind those models later in the article.
Find out why Caesars Entertainment’s 1.2% return over the last year is lagging behind its peers.
Approach 1: Caesars Entertainment Discounted Cash Flow (DCF) Analysis
A Discounted Cash Flow model projects a company’s future cash flows and then discounts them back to today using a required return, giving an estimate of what the business might be worth right now.
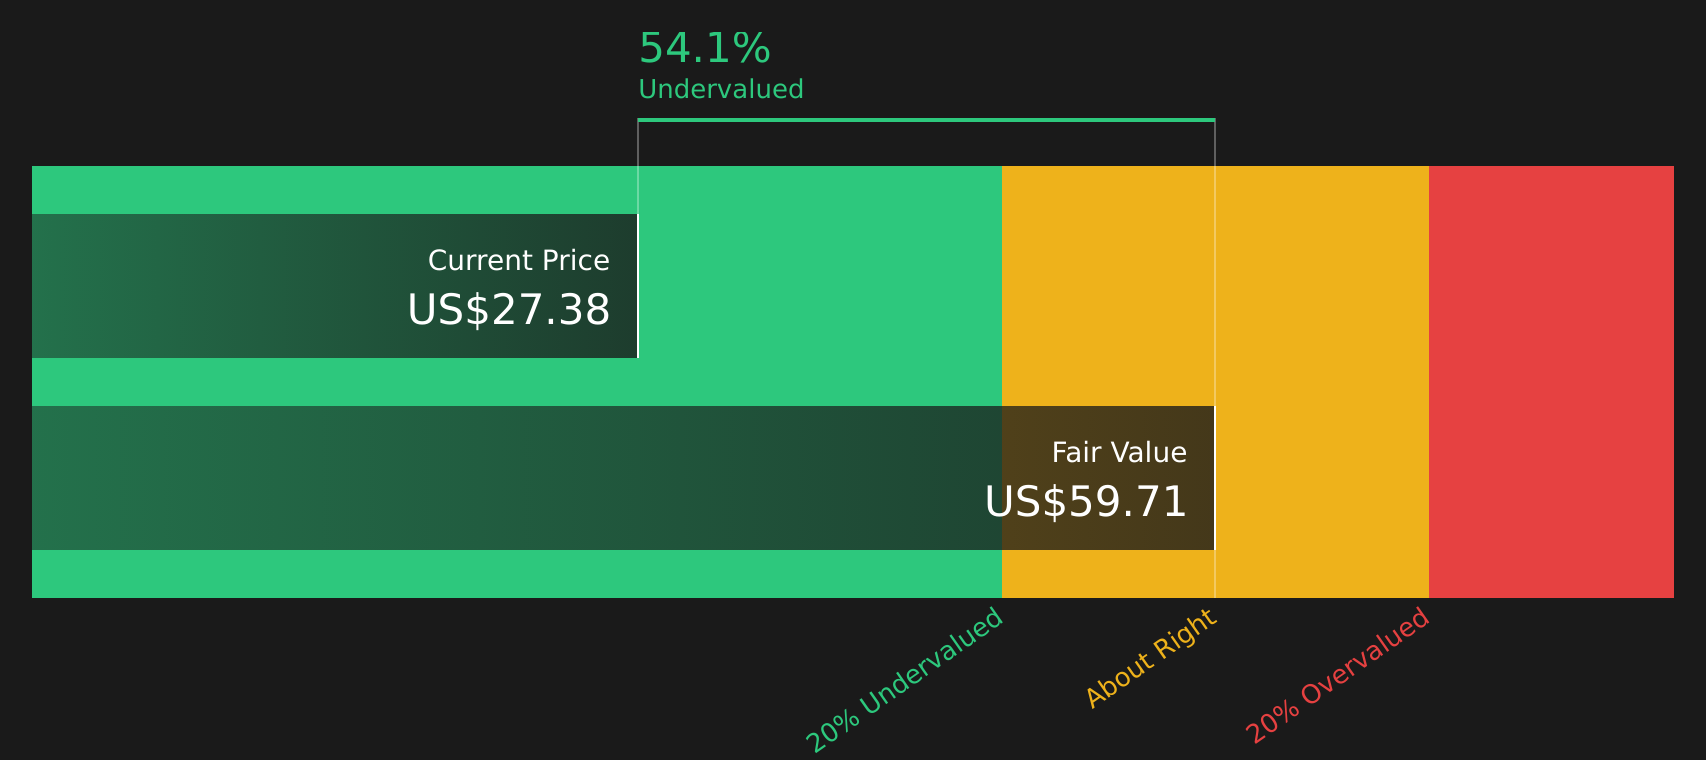
For Caesars Entertainment, the model used is a 2 Stage Free Cash Flow to Equity approach based on cash flow projections. The latest twelve month Free Cash Flow is about $172.2 million. Analyst and extrapolated estimates suggest Free Cash Flow moving into the range of roughly $920.6 million in 2026 and $1,524.5 million in 2035, with the intermediate years stepping up between those points. These future figures are discounted back to today to arrive at an estimated intrinsic value per share of $59.71.
Compared with the current share price of about $27.38, the DCF output implies an intrinsic discount of 54.1%. This indicates that Caesars Entertainment stock is priced well below this cash flow based estimate.
Result: UNDERVALUED
Our Discounted Cash Flow (DCF) analysis suggests Caesars Entertainment is undervalued by 54.1%. Track this in your watchlist or portfolio, or discover 52 more high quality undervalued stocks.
Approach 2: Caesars Entertainment Price vs Sales
For companies where earnings can be volatile, the P/S ratio is often a useful cross check because it compares the share price to the revenue the business generates, rather than to accounting profit. What investors are really weighing is how much they are paying for each dollar of sales, given the company’s growth outlook and risk profile.
In general, faster and more predictable growth, stronger margins and lower risk tend to support a higher “normal” or “fair” P/S multiple, while weaker growth or higher uncertainty usually point to a lower multiple. Caesars Entertainment currently trades on a P/S ratio of 0.48x. That sits well below the Hospitality industry average of 1.60x and the peer average of 2.13x.
Simply Wall St’s Fair Ratio for Caesars Entertainment is 1.35x, which is its proprietary view of what the P/S should be after considering factors such as growth, risks, profit margins, market cap and the company’s industry. This tailored metric can be more informative than a simple comparison to peers or the sector, because it adjusts for company specific characteristics instead of relying on broad averages. Compared with this 1.35x Fair Ratio, the current 0.48x P/S suggests the shares may be trading below that indicated level.
Result: UNDERVALUED

P/S ratios tell one story, but what if the real opportunity lies elsewhere? Start investing in legacies, not executives. Discover our 17 top founder-led companies.
Upgrade Your Decision Making: Choose your Caesars Entertainment Narrative
Earlier it was mentioned that there is an even better way to understand valuation. Narratives are Simply Wall St’s way of letting you attach a clear story to your numbers by linking your view on Caesars Entertainment’s future revenue, earnings and margins to a forecast and then to a Fair Value that you can compare with today’s price.
On the Community page, where millions of investors share their work, Narratives are easy to use because you simply choose the assumptions that match your view, and the platform instantly turns that into a Fair Value and updates it when new earnings, news or price targets arrive.
For Caesars Entertainment, one investor might lean toward a bullish Narrative that lines up with a Fair Value around US$41.00, built on faster growth and higher margins. Another might pick a cautious Narrative closer to US$22.00, focused on slower growth and higher risks. By comparing each Fair Value to the current price, you can decide whether the gap between your story and the market justifies considering a trade or waiting for a better entry or exit point.
For Caesars Entertainment, however, we will make it really easy for you with previews of two leading Caesars Entertainment Narratives:
Think of these as ready made storylines that connect the same set of facts to very different conclusions about what the current share price around US$27.38 really reflects.
🐂 Caesars Entertainment Bull Case
Fair value: US$32.57
Implied discount vs this narrative: around 15.9% below its fair value
Revenue growth used in the narrative: 2.38% a year
- Focuses on Caesars Digital growth, loyalty program data and property upgrades as key drivers of recurring revenue, more stable margins and higher free cash flow.
- Builds in revenue that reaches US$12.3b and earnings of US$230.7m by about April 2029, with margins improving from a loss today to a 1.9% profit margin over 3 years.
- Relies on the market eventually valuing those earnings at a P/E of 38.2x and factors in analyst takeover interest and free cash flow yield as support for the valuation, while highlighting debt, capital spending and labor costs as the main risks.
🐻 Caesars Entertainment Bear Case
Fair value: US$22.00
Implied premium vs this narrative: around 24.5% above its fair value
Revenue growth used in the narrative: 1.30% a year
- Assumes slower growth as digital gaming habits and changing demographics weigh on traditional casinos, with high leverage, aging properties and limited international exposure keeping pressure on cash flow.
- Builds a path where revenue reaches US$11.8b and earnings are US$87.2m by about August 2028, with profit margins moving from a loss to just 0.7% in 3 years and free cash flow needing to fund both upgrades and debt.
- Anchors on a very cautious price target of US$27.00 from the most bearish analysts, close to the current price, and flags that even this view still requires the market to support a very high P/E multiple on those future earnings.
Put simply, the bullish narrative sees digital growth, loyalty economics and reinvestment into properties as enough to support a fair value above today’s price. In contrast, the bearish narrative puts more weight on leverage, renovation needs and changing customer behavior and lands on a fair value below it.
If you want to see how these headline assumptions are built up from detailed forecasts, risks and valuation math for Caesars Entertainment, the full range of community and analyst views is just a few clicks away through Simply Wall St’s narrative tools, including both the bullish and bearish cases highlighted here.
To see how these results tie into long-term growth, risks, and valuation, check out the full range of community narratives for Caesars Entertainment on Simply Wall St. Add the company to your watchlist or portfolio so you’ll be alerted when the story evolves.
Do you think there’s more to the story for Caesars Entertainment? Head over to our Community to see what others are saying!

This article by Simply Wall St is general in nature. We provide commentary based on historical data
and analyst forecasts only using an unbiased methodology and our articles are not intended to be financial advice. It does not constitute a recommendation to buy or sell any stock, and does not take account of your objectives, or your
financial situation. We aim to bring you long-term focused analysis driven by fundamental data.
Note that our analysis may not factor in the latest price-sensitive company announcements or qualitative material.
Simply Wall St has no position in any stocks mentioned.
New: AI Stock Screener & Alerts
Our new AI Stock Screener scans the market every day to uncover opportunities.
• Dividend Powerhouses (3%+ Yield)
• Undervalued Small Caps with Insider Buying
• High growth Tech and AI Companies
Or build your own from over 50 metrics.
Have feedback on this article? Concerned about the content? Get in touch with us directly. Alternatively, email [email protected]
‘ The preceding article may include information circulated by third parties ’
‘ Some details of this article were extracted from the following source simplywall.st ’