If you are wondering whether Flutter Entertainment is starting to look attractively priced or still has more room to fall before it offers value, this article walks through what the current share price might really be telling you.
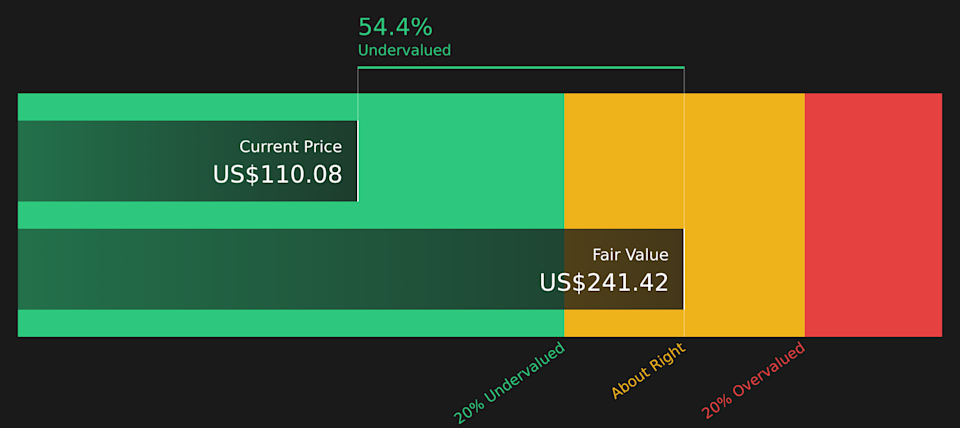
The stock last closed at US$110.08, with recent returns of 4.5% over 7 days and 5.0% over 30 days, set against a much larger 49.6% decline year to date and a 50.3% decline over the past year.
These price moves sit against a backdrop of ongoing attention on Flutter Entertainment as a major player in online sports betting and gaming, with investors watching how regulatory developments and competitive pressures affect sentiment. Broader sector news around consumer behavior in betting and digital entertainment has also kept the stock on many watchlists.
On Simply Wall St’s 6 point valuation framework, the company currently scores 5 out of 6. This sets up a closer look at how different valuation methods stack up for Flutter Entertainment and hints at an even more complete way to think about valuation that will be covered at the end of this article.
A Discounted Cash Flow model takes estimates of a company’s future cash flows and discounts them back to today’s value, so you can compare that value with the current share price.
For Flutter Entertainment, Simply Wall St uses a 2 Stage Free Cash Flow to Equity model. The latest twelve month free cash flow is about $394.4 million. Analysts provide explicit free cash flow estimates for the next few years and, after that, Simply Wall St extrapolates the projections, with free cash flow expected to reach about $3.1b in 2030 based on those inputs.
When all projected cash flows are discounted back to today, the model arrives at an estimated intrinsic value of about $241.42 per share. Compared with the recent share price of around $110.08, this implies Flutter Entertainment trades at roughly a 54.4% discount to that DCF estimate. On this basis, the shares appear undervalued within this framework.
For companies where profits can be uneven but revenue is more stable, the P/S ratio is often a useful yardstick because it compares what you are paying with the sales the business is already generating. It still reflects growth expectations and risk, since investors usually accept a higher P/S multiple when they expect stronger growth or see less risk, and a lower multiple when expectations are more muted or risks feel higher.
Flutter Entertainment currently trades on a P/S of about 1.17x. This sits below both the Hospitality industry average of around 1.68x and the peer average of about 1.74x. Simply Wall St also calculates a proprietary “Fair Ratio” for Flutter Entertainment of 2.77x, which is the P/S multiple suggested by factors such as its earnings growth profile, industry, profit margins, market cap and risks.
This Fair Ratio goes a step beyond simple peer and industry comparisons because it attempts to align the multiple with the company’s specific characteristics rather than broad group averages. Comparing the current 1.17x P/S with the 2.77x Fair Ratio points to Flutter Entertainment trading below that modelled level.
Earlier it was mentioned that there is an even better way to understand valuation. Meet Narratives, which let you attach a clear story about Flutter Entertainment to the hard numbers such as your own fair value, revenue, earnings and margin assumptions. You can then link that story to a financial forecast that Simply Wall St turns into a Fair Value you can compare with the current price to inform buy or sell decisions.
On the Simply Wall St Community page, Narratives are easy to use and update automatically when new data, news or earnings arrive. For example, one investor might think Flutter Entertainment eventually justifies a Fair Value around US$369.27, while another might focus on a more cautious view closer to US$226.48, or around the US$197.35 consensus. Each Narrative clearly ties that viewpoint to specific numbers, and you can see where your own view fits within that range.
This article by Simply Wall St is general in nature. We provide commentary based on historical data and analyst forecasts only using an unbiased methodology and our articles are not intended to be financial advice. It does not constitute a recommendation to buy or sell any stock, and does not take account of your objectives, or your financial situation. We aim to bring you long-term focused analysis driven by fundamental data. Note that our analysis may not factor in the latest price-sensitive company announcements or qualitative material. Simply Wall St has no position in any stocks mentioned.