Track your investments for FREE with Simply Wall St, the portfolio command center trusted by over 7 million individual investors worldwide.
If you are wondering whether Tencent Music Entertainment Group’s current share price reflects its true worth, the recent swings make that question even more pressing.
The stock closed at US$10.09, with returns of a 28.9% decline over 7 days, a 33.6% decline over 30 days, a 43.5% decline year to date, a 27.0% decline over 1 year, a 34.5% gain over 3 years, and a 48.7% decline over 5 years.
Recent news coverage has focused on Tencent Music Entertainment Group in the context of broader sentiment toward Chinese technology and entertainment platforms, including changing views on regulatory risk and user growth trajectories. This backdrop helps explain why the share price has been volatile even when company specific headlines have been relatively limited.
Right now, Tencent Music Entertainment Group has a valuation score of 5 out of 6. The rest of this article will walk through what different valuation methods say about that score, and then finish with a way to think about value that goes beyond the numbers alone.
A Discounted Cash Flow, or DCF, model estimates what a company might be worth by projecting its future cash flows and then discounting those back to a single value today.
For Tencent Music Entertainment Group, the model used is a 2 Stage Free Cash Flow to Equity approach based on cash flows in CN¥. The latest twelve month free cash flow sits at about CN¥9.0b. Analyst and extrapolated projections run out to 2035, with free cash flow for 2030 projected at CN¥12.7b, and interim years such as 2026 and 2027 sitting in the CN¥10.7b to CN¥10.9b range before further extrapolations take over.
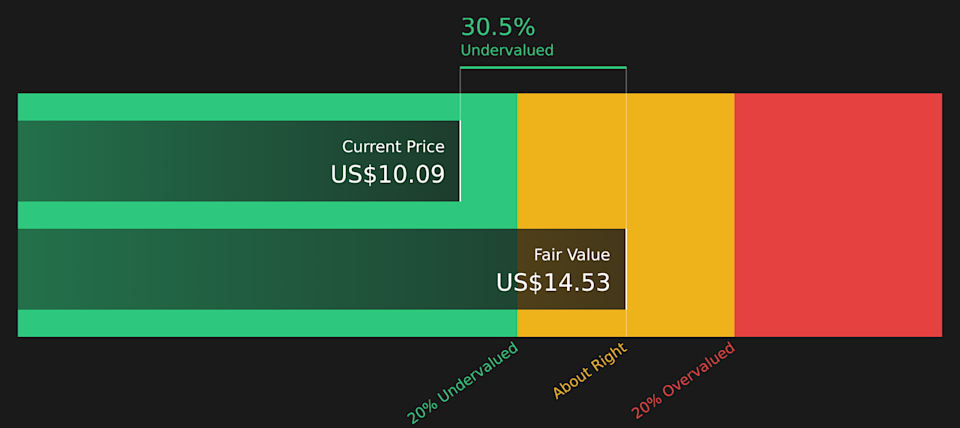
When those projected cash flows are discounted back, Simply Wall St’s model arrives at an estimated intrinsic value of US$14.53 per share, compared with a recent share price of US$10.09. That gap implies the shares trade at about a 30.5% discount to this particular cash flow based estimate.
For profitable companies, the P/E ratio is a useful shorthand because it links what you pay directly to the earnings the business is already generating. It gives a quick sense of how many years of current earnings the market is pricing into the stock.
What counts as a “normal” P/E depends a lot on how fast earnings are expected to grow and how risky those earnings are. Higher expected growth or lower perceived risk can justify a higher P/E, while slower growth or higher uncertainty usually points to a lower P/E.
Tencent Music Entertainment Group currently trades on a P/E of 9.73x. That sits well below the Entertainment industry average P/E of 34.22x and the broader peer group average of 81.15x. Simply Wall St’s Fair Ratio for Tencent Music Entertainment Group is 20.35x, which is its proprietary estimate of what a reasonable P/E could be given factors such as earnings growth, profit margins, industry, market cap and company specific risks.
This Fair Ratio framework can be more informative than a simple comparison with industry or peers because it adjusts for Tencent Music Entertainment Group’s own characteristics rather than assuming it should trade in line with others. With a Fair Ratio of 20.35x versus the current 9.73x, Tencent Music Entertainment Group screens as trading below this tailored P/E reference point.
Earlier it was mentioned that there is an even better way to understand valuation. Narratives bring this together by letting you set a clear story for Tencent Music Entertainment Group, tie that story to explicit forecasts for revenue, earnings and margins, and then compare your own Fair Value with the latest price. All of this is within Simply Wall St’s Community page, where different views range from a higher US$32.95 fair value to a lower US$16.95. These are automatically refreshed when new earnings or news arrive so you can quickly see whether your story still supports holding, adding or reducing your exposure.
This article by Simply Wall St is general in nature. We provide commentary based on historical data and analyst forecasts only using an unbiased methodology and our articles are not intended to be financial advice. It does not constitute a recommendation to buy or sell any stock, and does not take account of your objectives, or your financial situation. We aim to bring you long-term focused analysis driven by fundamental data. Note that our analysis may not factor in the latest price-sensitive company announcements or qualitative material. Simply Wall St has no position in any stocks mentioned.