- If you are wondering whether Universal Music Group at around €19.87 is offering value or just noise, the recent share performance gives you a useful starting point.
- The stock has moved 16.8% over the past 7 days and 14.8% over the past 30 days, while the year to date return sits at a 9.5% decline and the 1 year return at an 11.7% decline, which can affect how the current price is viewed.
- These moves have come alongside ongoing interest in the broader music and entertainment sector and continued attention on how large media groups are positioned in areas such as catalog strength, artist relationships and digital distribution. For Universal Music Group, investors have been weighing its role as a major rights holder and how that might influence the long term value of its catalog and partnerships.
- Despite this backdrop, Universal Music Group currently scores only 1 out of 6 on Simply Wall St’s valuation checks. The rest of this article will walk through different valuation approaches and then finish with a framework that can help you interpret these numbers more clearly.
Universal Music Group scores just 1/6 on our valuation checks. See what other red flags we found in the full valuation breakdown.
Approach 1: Universal Music Group Discounted Cash Flow (DCF) Analysis
A Discounted Cash Flow, or DCF, model takes estimates of a company’s future cash flows, then discounts them back to today’s value to arrive at an intrinsic value per share.
For Universal Music Group, the model used is a 2 Stage Free Cash Flow to Equity approach. The latest twelve month free cash flow sits at about €1.56b. Analyst and extrapolated estimates suggest free cash flow in 2030 of around €1.84b, with interim projections between 2026 and 2035 ranging from roughly €1.38b to €1.81b each year, all in €.
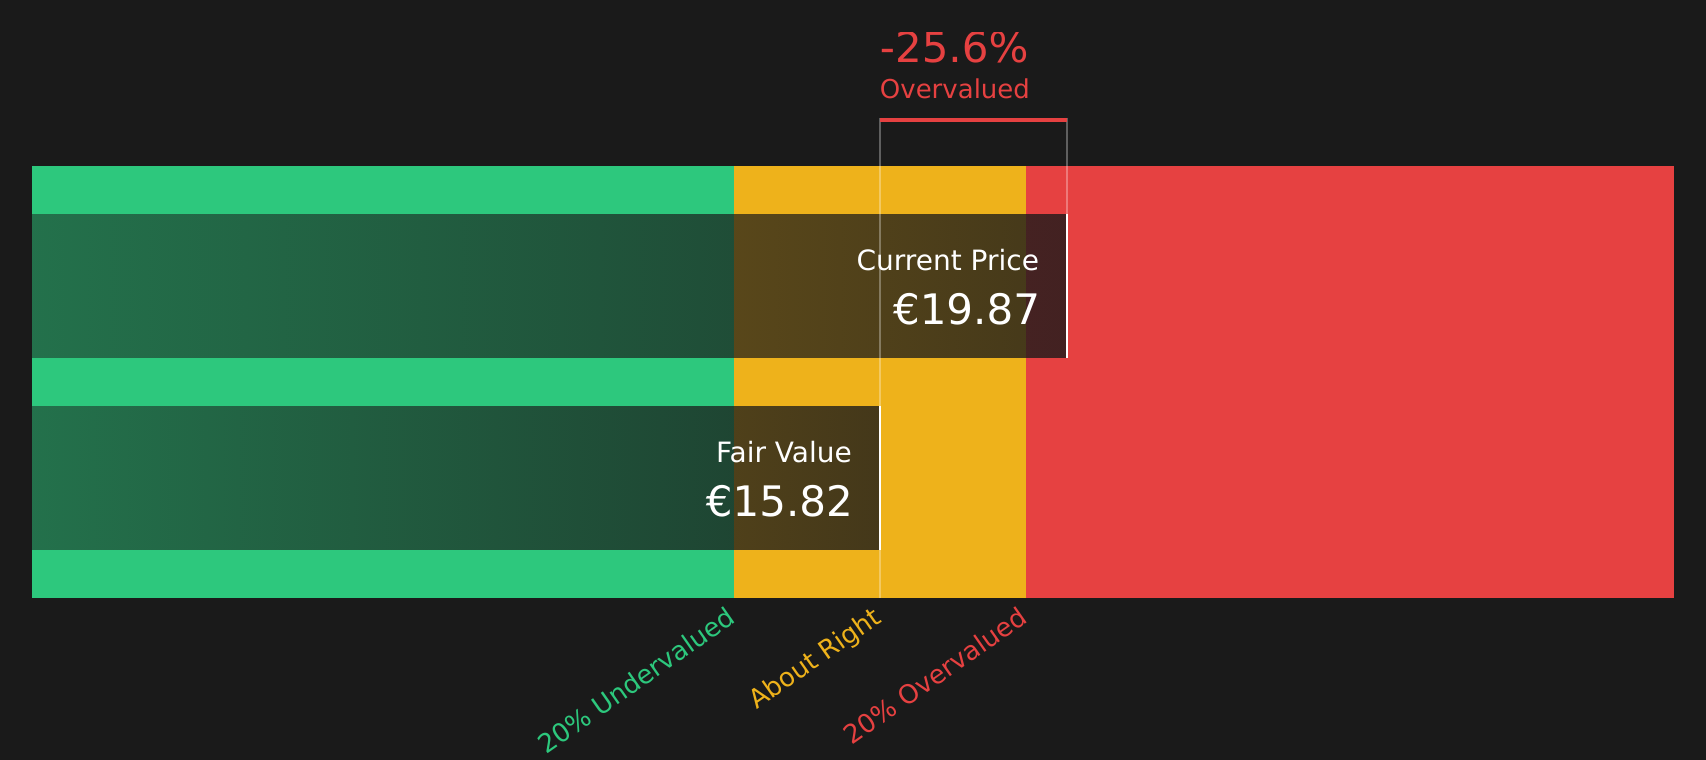
When Simply Wall St discounts these projected cash flows back to today using its assumptions, the resulting intrinsic value is €15.82 per share. Against a current share price around €19.87, the DCF output indicates the stock is about 25.6% above this estimate, which, within this model, suggests it may be overvalued.
Result: OVERVALUED
Our Discounted Cash Flow (DCF) analysis suggests Universal Music Group may be overvalued by 25.6%. Discover 241 high quality undervalued stocks or create your own screener to find better value opportunities.
Approach 2: Universal Music Group Price vs Earnings
For a profitable company, the P/E ratio is a useful shorthand for how much investors are paying for each euro of earnings. This makes it a common way to compare valuation across similar businesses.
What counts as a reasonable P/E often reflects how the market views the company’s growth prospects and risk profile. Higher expected growth or lower perceived risk can support a higher multiple, while slower growth or higher risk usually points to a lower one.
Universal Music Group currently trades on a P/E of about 23.8x. That sits above the Entertainment industry average of around 17.4x and below a peer group average of roughly 56.1x, so the stock is priced at a premium to the broader industry but not to the most highly valued peers.
Simply Wall St’s Fair Ratio for Universal Music Group is 15.0x. This is a proprietary estimate of what a reasonable P/E could be for the company, given its earnings growth profile, profit margins, industry, market cap and specific risks. Because it adjusts for these company level factors, it can be more tailored than a simple comparison with industry or peer averages.
Comparing the Fair Ratio of 15.0x with the current P/E of 23.8x suggests the shares are trading above this tailored reference point.
Result: OVERVALUED

P/E ratios tell one story, but what if the real opportunity lies elsewhere? Start investing in legacies, not executives. Discover our 96 top founder-led companies.
Upgrade Your Decision Making: Choose your Universal Music Group Narrative
Earlier it was mentioned that there is an even better way to understand valuation, so Narratives are introduced here as a simple way for you to connect your view of Universal Music Group’s story with explicit assumptions about future revenue, earnings and margins. You can then convert that into your own fair value and compare it with the current price to consider whether you see potential upside or downside.
On Simply Wall St’s Community page, Narratives let you pick or create a storyline, link it to a forecast, and instantly see a fair value that updates when new information like news or earnings arrives. This means you are not just reacting to price moves but weighing price against a model that evolves with new data.
For Universal Music Group, one investor might align with a cautious Narrative that anchors to a fair value around €15.00 and focuses on AI disruption risk to catalog economics, while another might consider an optimistic Narrative closer to €36.91 that emphasizes catalog strength and AI partnerships. The platform helps you see both side by side so you can decide which story best fits your own expectations.
For Universal Music Group however we’ll make it really easy for you with previews of two leading Universal Music Group Narratives:
🐂 Universal Music Group Bull Case
Fair value in this bullish Narrative: €36.91 per share.
Current price vs this fair value: around 46.1% below the Narrative fair value, using the latest close of €19.87.
Revenue growth assumption: 9.92% a year.
- This Narrative assumes UMG can turn its global scale, catalog depth and presence in markets like China, India and Latin America into strong subscription growth and higher earnings over time.
- It also builds in upside from tech and AI partnerships, virtual or immersive experiences and better monetisation of short form and social platforms to support higher margins.
- It requires confidence that by 2029 UMG can reach about €16.6b in revenue, around €2.4b in earnings and support a P/E of 35.7x when discounted back using a 7.6% rate.
🐻 Universal Music Group Bear Case
Fair value in this bearish Narrative: €15.00 per share.
Current price vs this fair value: around 32.5% above the Narrative fair value, using the latest close of €19.87.
Revenue growth assumption: 7.28% a year.
- This Narrative frames AI generated music, fragmented consumption across gaming and social apps, and cheaper independent content as headwinds for UMG’s catalog value and pricing power.
- It assumes rising internal costs, pressure on royalty economics and dependence on superstar artists keep a lid on margin progress and make earnings more volatile.
- It builds to a 2029 view of roughly €15.4b of revenue and €1.8b of earnings, supported by a lower P/E of 19.2x and a 7.4% discount rate, which together point to the €15.00 fair value anchor.
If you want to move beyond these snapshots and see the full range of Narratives other investors are using, including their own assumptions on growth, margins and risk, See what the community is saying about Universal Music Group.
Do you think there’s more to the story for Universal Music Group? Head over to our Community to see what others are saying!

This article by Simply Wall St is general in nature. We provide commentary based on historical data
and analyst forecasts only using an unbiased methodology and our articles are not intended to be financial advice. It does not constitute a recommendation to buy or sell any stock, and does not take account of your objectives, or your
financial situation. We aim to bring you long-term focused analysis driven by fundamental data.
Note that our analysis may not factor in the latest price-sensitive company announcements or qualitative material.
Simply Wall St has no position in any stocks mentioned.
New: AI Stock Screener & Alerts
Our new AI Stock Screener scans the market every day to uncover opportunities.
• Dividend Powerhouses (3%+ Yield)
• Undervalued Small Caps with Insider Buying
• High growth Tech and AI Companies
Or build your own from over 50 metrics.
Have feedback on this article? Concerned about the content? Get in touch with us directly. Alternatively, email [email protected]
‘ The preceding article may include information circulated by third parties ’
‘ Some details of this article were extracted from the following source simplywall.st ’