Report Overview
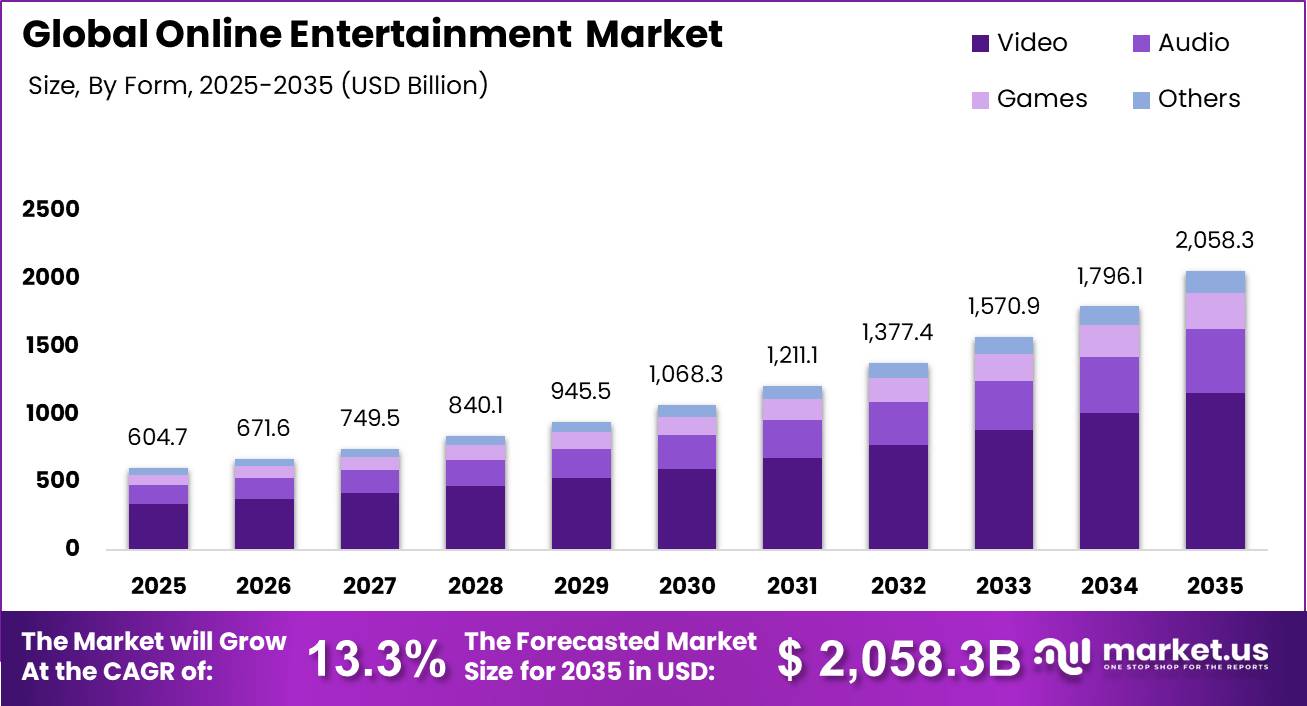
Global Online Entertainment Market size is expected to be worth around USD 2,058.30 Billion by 2035 from USD 604.7 Billion in 2025, growing at a CAGR of 13.30% during the forecast period 2026 to 2035.
The online entertainment market covers digital content delivery across video streaming, audio platforms, gaming, and other interactive formats monetized through subscriptions, advertising, sponsorships, and hybrid models. This market spans consumer-facing platforms operating across connected TVs, smartphones, desktops, and emerging device categories. This reflects a broad shift in how audiences globally consume and pay for entertainment content.
Key Takeaways
- Online Entertainment Market value in 2025 stands at USD 604.7 Billion, forecast to reach USD 2,058.30 Billion by 2035.
- The market grows at a CAGR of 13.30% from 2026 to 2035.
- By Form, Video dominates with a 56.20% share in 2025.
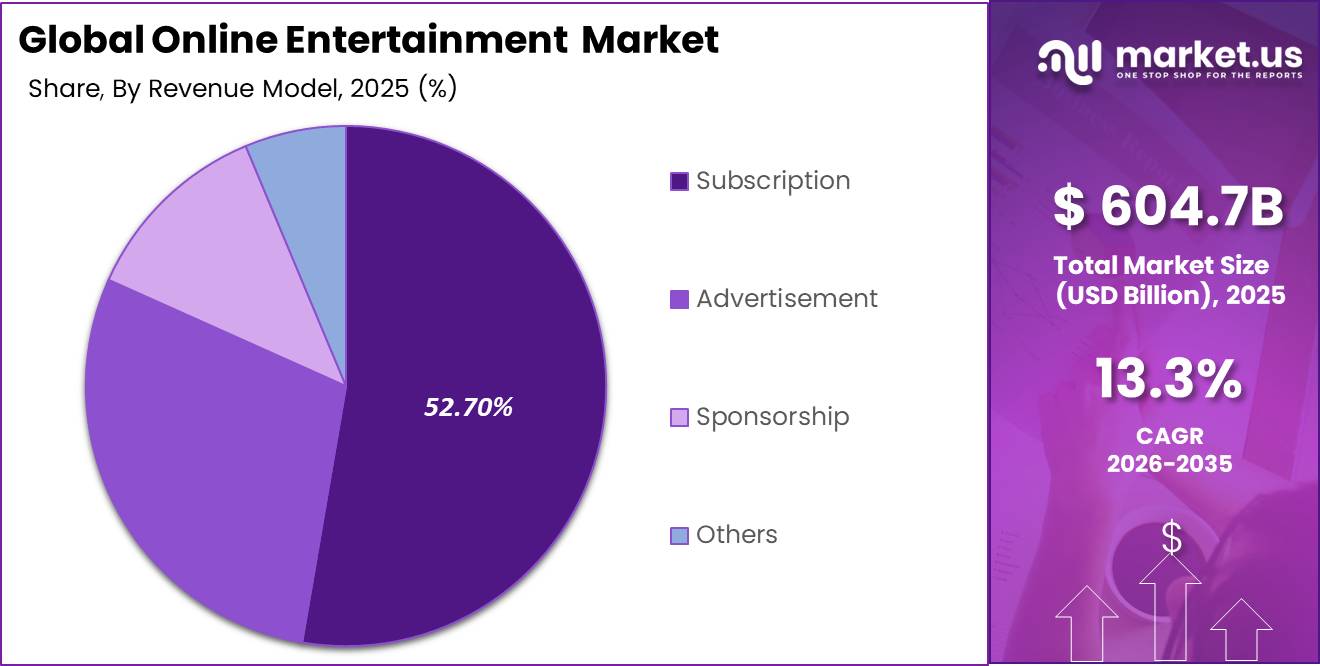
- By Revenue Model, Subscription leads with a 52.70% share in 2025.
- By Device, Smartphones and Mobile Phones hold the largest share at 56.80% in 2025.
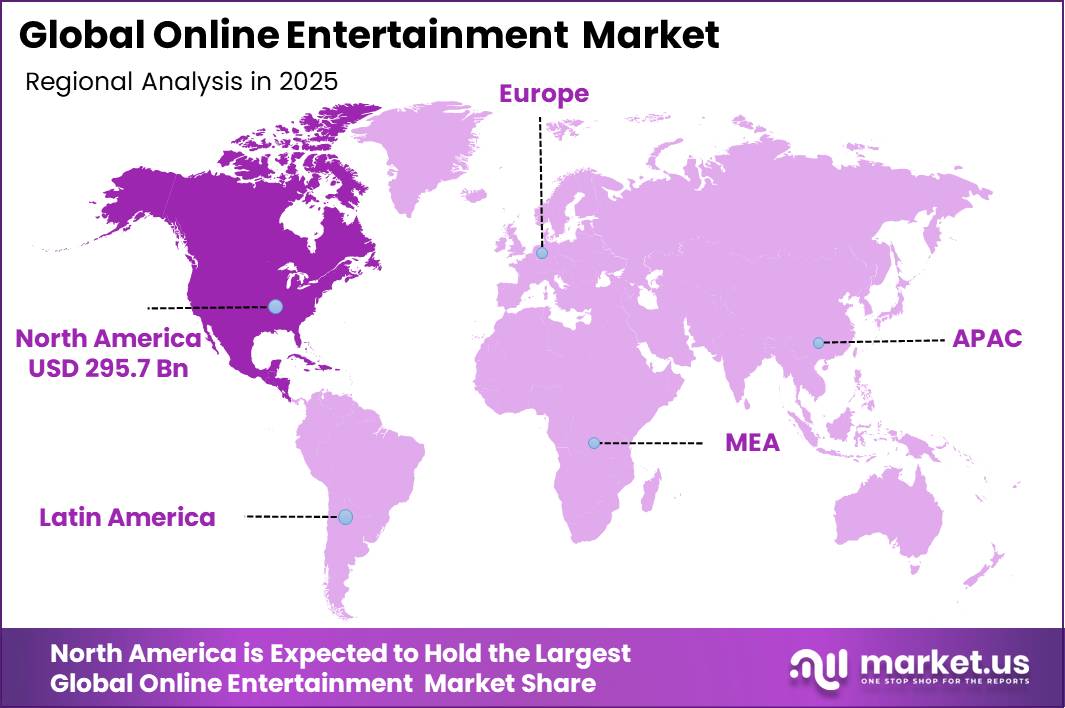
- North America is the dominant region with a 48.9% market share, valued at USD 295.7 Billion in 2025.
Government investment and regulatory policy shape how platforms operate across major markets. The European Union’s Digital Markets Act and data privacy frameworks impose compliance costs on large platform operators. These regulations affect how platforms target advertising and share data with third parties. Investors evaluating platforms with EU exposure must factor in these structural compliance burdens.
According to The Guardian, YouTube average daily usage reached 99.1 minutes per user globally in 2025, surpassing Netflix in cross-country viewing attention. This signals a structural rebalancing of audience time toward open, ad-supported platforms. Subscription-led platforms face direct pressure on engagement share, which advertisers increasingly use to allocate digital video budgets.
As reported by TVBEurope, Netflix average daily viewing fell to 93.4 minutes per user in 2025, reflecting a shift in attention from subscription OTT toward open platforms. This gap between YouTube and Netflix viewing time creates a monetization risk for pure subscription models. Platforms that do not build ad-supported tiers will find it harder to retain advertiser interest and audience time simultaneously.
Video Analysis
Video dominates with 56.20% due to broad platform availability and algorithmic engagement loops.
In 2025, Video held a dominant market position in the By Form segment of the Online Entertainment Market, with a 56.20% share. Data from Reuters shows over 94% of online adults in major markets use YouTube, making video the default consumption format at scale. This adoption depth makes video the most defensible segment for platform investment and advertiser allocation.
Audio platforms hold a structurally distinct position within the online entertainment ecosystem. Streaming audio, including music and podcasting, captures commute, fitness, and background listening contexts that video cannot address. This non-competitive time slot means audio retains a loyal daily user base, and platforms operating in this segment benefit from habitual consumption patterns that reduce churn pressure.
Games represent a high-monetization segment within the online entertainment landscape. Mobile and console gaming drives in-app purchases, subscriptions, and advertising revenue across APAC and North American corridors. Figures from the data block show mobile gaming and in-app spend deepening contributes a +1.7% CAGR impact, making games a priority segment for revenue diversification strategies.
Revenue Model Analysis
Subscription dominates with 52.70% due to predictable recurring revenue and bundle retention incentives.
In 2025, Subscription held a dominant market position in the By Revenue Model segment of the Online Entertainment Market, with a 52.70% share. Based on the data block, hybrid monetization models combining SVOD, AVOD, and FAST channels are reaching a ~$340 Billion global revenue structure in 2026. This scale confirms subscription as the anchor model, but the trajectory points toward blended architectures that layer advertising revenue alongside subscription fees.
Advertisement-based revenue is the fastest-shifting model within the online entertainment market. FAST channels are reaching approximately $12 Billion in ad revenue with a 35% CAGR, as reported in the data block. This rate signals that free ad-supported streaming is no longer a niche complement to subscriptions. Platforms without an AVOD or FAST layer are structurally exposed to advertiser budget migration.
Sponsorship and other revenue models occupy a smaller but growing share of platform income. Creator-driven sponsorships, branded content integrations, and live event monetization add non-subscription revenue streams. These models are particularly relevant in markets where subscription willingness is low, giving platforms an additional pathway to monetize large user bases that resist paid tiers.
Device Analysis
Smartphones/Mobile Phones dominate with 56.80% due to mobile-first internet penetration in high-growth markets.
In 2025, Smartphones and Mobile Phones held a dominant market position in the By Device segment of the Online Entertainment , with a 56.80% share. India alone accounts for over 601 Million OTT users driven by smartphone-led internet access, according to the data block. This concentration of mobile users in a single market signals where platform localization and low-bandwidth optimization strategies generate the highest subscriber returns.
TV-connected devices are gaining strategic importance despite lower overall device share. TVBTechnology data shows YouTube captured 28% of total streaming minutes on connected TV, ahead of Netflix at 15% in US viewing ecosystems. This inversion challenges the premium-screen assumption that subscription platforms once held. Platforms that fail to compete for CTV inventory risk losing the highest-CPM advertising environment in digital video.
Desktop and laptop devices retain relevance in professional and long-form content consumption contexts. Work-from-home patterns sustained desktop streaming habits that predated mobile growth cycles. This segment offers platforms a secondary surface for engagement during daytime hours, complementing the primetime TV and evening mobile peaks that define most platform traffic models.
Key Market Segments
By Form
By Revenue Model
- Subscription
- Advertisement
- Sponsorship
- Others
By Device
- TV
- Smartphones/Mobile Phones
- Desktop/Laptop
- Others
Drivers
The migration of audiences toward connected-TV platforms is a primary growth driver for the online entertainment industry. Viewing is shifting from mobile and desktop to larger-screen environments that attract higher-value advertising budgets previously tied to linear television. As streaming evolves into a combination of SVOD, AVOD, FAST, sports content, and retail-media integrations, platforms are increasing monetization per viewing hour while diversifying revenue streams.
This shift is strengthening the industry’s economic model by attracting a broader advertiser base and enabling more premium ad inventory. Netflix reached 301.6 million paid memberships, and Warner Bros. Discovery ended 2025 with 131.6 million streaming subscribers, demonstrating continued expansion of premium digital video consumption. These membership levels signal advertiser confidence in streaming as a primary video channel over linear broadcast alternatives.
Business Insider data shows Netflix’s global content consumption exceeded 191 billion viewing hours annually, confirming continued scale potential for premium OTT ecosystems. Paramount+ and Pluto TV combined reached approximately 20 billion viewing hours in 2025, showing strong expansion in hybrid streaming platforms. These numbers confirm that both premium and free ad-supported tiers are building durable audience volume that supports long-term revenue diversification.
Restraints
Subscription fatigue has become a structural challenge for the online entertainment industry as consumers manage multiple digital subscriptions and rotate between services. Many households now maintain only 2–3 core streaming subscriptions while cycling through additional services based on content availability. This rotation weakens the long-term retention assumptions that previously supported subscription-driven growth models across North America, Western Europe, and Australia.
Platforms increasingly rely on discounts, bundled offerings, annual plans, and ad-supported tiers to reduce churn. These retention tools reduce subscription revenue per user by 10–20% compared with standard pricing. At the same time, customer acquisition costs continue to rise, extending CAC payback periods from approximately 8–12 months to 14–18 months in some markets, limiting the financial case for aggressive subscriber expansion into lower-value segments.
Challenges
Peak-load bandwidth strain is a persistent operational challenge for video streaming platforms as traffic concentrates around evening viewing periods, live events, and premium content releases. The core issue is demand concentration, not total capacity. Traffic in mature markets reaches 2.5–3.0 times normal daytime levels, and major live events generate an additional 20–30% surge in network load, forcing platforms to overprovision infrastructure or risk service failure at the highest-value viewing moments.
Platforms often provision content delivery infrastructure 25–40% above average demand to maintain stream quality, increasing delivery costs by an estimated 3–5% per viewing hour in congested regions. This cost structure disproportionately impacts smaller platforms competing against incumbents with owned CDN infrastructure. The deployment of edge caching and next-generation codecs requires 18–36 months of investment before cost savings materialize, limiting near-term relief for operators facing this challenge.
Opportunities
The integration of advanced advertising technology with shoppable video experiences creates a direct commerce monetization layer within streaming platforms. Traditional video advertising conversion rates remain below 1%, but shoppable formats can increase conversion rates to 2–4% in categories such as beauty, fashion, home products, and digital goods. This gap between current and achievable conversion rates represents measurable revenue upside for platforms that invest in commerce infrastructure.
Enhanced commerce integration can improve effective advertising yields by 30–50% while creating higher-margin revenue streams beyond conventional media advertising. However, adoption remains limited due to fragmented technology ecosystems. Many platforms lack the integrated identity, payment, data, and measurement infrastructure required to support large-scale deployment. Platforms that build this stack first will capture advertiser budgets migrating from traditional display to commerce-enabled video formats.
Consumer behavior remains an obstacle, as streaming and shopping are still largely separate activities. Less than 5% overlap exists between frequent viewers and in-session purchasers in many markets. As platforms invest in commerce-enabled advertising, retail partnerships, and data infrastructure over the next 12–24 months, shoppable video is positioned to become an increasingly important monetization lever. Early movers that close this behavior gap will establish advertiser relationships that become structurally difficult for competitors to displace.
Regional Analysis
North America Dominates the Online Entertainment Market with a Market Share of 48.9%, Valued at USD 295.7 Billion
North America holds the largest regional position in the online entertainment market, anchored by mature CTV advertising ecosystems and high per-user subscription spend. Figures from the data block show YouTube’s share of TV screen viewing rose from 28% to 35% within one year in major markets, and this trend is most pronounced in North America. This rapid shift toward TV-based digital consumption expands premium ad inventory, reinforcing the region’s lead over all other geographies.
Europe holds a structurally significant position driven by high broadband penetration and premium subscription adoption across Western markets. EU data privacy regulation under GDPR and the Digital Markets Act creates compliance complexity for platform operators. This regulatory environment raises barriers for new entrants while favoring established platforms with legal and engineering infrastructure already in place.
Asia Pacific presents the largest volume opportunity across any region. The data block confirms India alone accounts for over 601 Million OTT users, driven by smartphone-led internet access. This user base is monetized at lower average revenue per user than North America, making APAC a high-volume, lower-margin region where advertising and ad-supported tiers generate more revenue than subscription models alone.
Latin America is a growth region where mobile-first consumption and localized content drive platform adoption. Subscription willingness is constrained by income levels, pushing platforms toward ad-supported and hybrid monetization models. Brazil and Mexico represent the largest addressable markets in the region, with urban populations showing higher engagement rates with premium video content.
Key Regions and Countries
North America
Europe
- Germany
- France
- The UK
- Spain
- Italy
- Rest of Europe
Asia Pacific
- China
- Japan
- South Korea
- India
- Australia
- Rest of APAC
Latin America
- Brazil
- Mexico
- Rest of Latin America
Middle East and Africa
- GCC
- South Africa
- Rest of MEA
Competitive Analysis
Netflix holds structural scale advantages across both subscription and advertising revenue models. The platform reached 301.6 million paid memberships globally, giving it unmatched negotiating leverage with studios and sports rights holders. However, its refusal to increase its acquisition bid to above $82.7 Billion for Warner Bros. Discovery signals a disciplined capital allocation posture that prioritizes margin over consolidation. This creates space for mid-tier competitors to acquire content assets Netflix declines to pursue.
Spotify occupies a defensible position in audio streaming with a global subscriber base and creator ecosystem. The AI music platform Suno raised $250 Million in November 2025, reaching a $2.45 Billion valuation while building AI-generated music tools that compete directly with licensed music streaming. This represents a structural threat to Spotify’s catalog-dependent model. Platforms that do not integrate AI audio generation tools risk losing both creator supply and listener engagement to lower-cost alternatives.
Key Players
- Netflix
- The Walt Disney Company
- Comcast Corporation
- Sony Group Corporation
- Nintendo Co., Ltd.
- Electronic Arts Inc.
- Spotify
- NetEase, Inc.
- Universal Music Group
- Amazon.com, Inc.
- Flutter Entertainment plc.
Recent Developments
- February 2026 – Netflix officially withdrew from the Warner Bros. Discovery bidding process after refusing to increase its offer above USD $82.7 Billion, ending its acquisition attempt and signaling a shift toward organic content investment over consolidation.
- November 2025 – AI music platform Suno raised USD $250 Million in funding, reaching a valuation of USD $2.45 Billion, while expanding AI-generated music tools that compete directly with traditional streaming licensing ecosystems.
Report Scope
‘ The preceding article may include information circulated by third parties ’
‘ Some details of this article were extracted from the following source market.us ’


![[Official] BTS 'Dynamite' music video reaches 2.1 billion views..sets new record](https://celebrity.land/en/wp-content/uploads/2026/06/Official-BTS-Dynamite-music-video-reaches-21-billion-viewssets-new-75x75.jpg)