Casino, sports betting and entertainment operator PENN Entertainment (NASDAQ:PENN) reported Q1 CY2026 results exceeding the market’s revenue expectations , with sales up 6.4% year on year to $1.78 billion. Its non-GAAP profit of $0.11 per share was significantly above analysts’ consensus estimates.
Revenue: $1.78 billion vs analyst estimates of $1.75 billion (6.4% year-on-year growth, 1.7% beat)
Adjusted EPS: $0.11 vs analyst estimates of -$0.01 (significant beat)
Adjusted EBITDA: $265.8 million vs analyst estimates of $411.9 million (14.9% margin, 35.5% miss)
Operating Margin: 5.5%, up from 2.6% in the same quarter last year
ADVERTISEMENT
Free Cash Flow was -$94.6 million compared to -$83.3 million in the same quarter last year
Market Capitalization: $1.87 billion
Established in 1982, PENN Entertainment (NASDAQ:PENN) is a diversified American operator of casinos, sports betting, and entertainment venues.
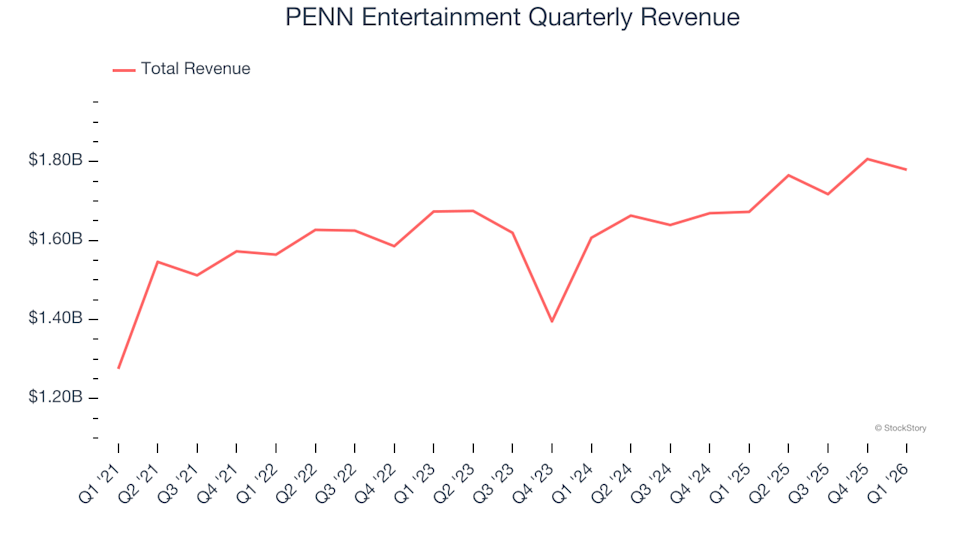
A company’s long-term performance is an indicator of its overall quality. Any business can have short-term success, but a top-tier one grows for years. Over the last five years, PENN Entertainment grew its sales at a 13.6% annual rate. Though this growth is acceptable on an absolute basis, we need to see more than just topline growth for the consumer discretionary sector, which can display significant earnings volatility. This means our bar for the sector is particularly high, reflecting the non-essential and hit-driven nature of the products and services offered. Additionally, five-year CAGR starts around Covid, when revenue was depressed then rebounded.
PENN Entertainment Quarterly Revenue
We at StockStory place the most emphasis on long-term growth, but within consumer discretionary, a stretched historical view may miss a company riding a successful new product or trend. PENN Entertainment’s recent performance shows its demand has slowed as its annualized revenue growth of 5.9% over the last two years was below its five-year trend. We’re wary when companies in the sector see decelerations in revenue growth, as it could signal changing consumer tastes aided by low switching costs. Note that COVID hurt PENN Entertainment’s business in 2020 and part of 2021, and it bounced back in a big way thereafter.
PENN Entertainment Year-On-Year Revenue Growth
We can better understand the company’s revenue dynamics by analyzing its most important segment, Northeast Region. Over the last two years, PENN Entertainment’s Northeast Region revenue (casinos, hotels) averaged 1.2% year-on-year growth. This segment has lagged the company’s overall sales.
PENN Entertainment Quarterly Revenue by Segment
This quarter, PENN Entertainment reported year-on-year revenue growth of 6.4%, and its $1.78 billion of revenue exceeded Wall Street’s estimates by 1.7%.
Looking ahead, sell-side analysts expect revenue to grow 4.5% over the next 12 months, similar to its two-year rate. This projection is underwhelming and implies its products and services will see some demand headwinds.
ONE MORE THING: 3 Hidden Platforms Growing 3X Faster than Amazon, Google, and PayPal. Amazon, Google, and Meta all followed the same playbook: Dominate an ignored market. Build an unbeatable moat. Scale until you’re unstoppable.
These three platforms are running that exact playbook right now. The early investors in Amazon made fortunes. The early investors in these could do the same. Get All 3 Stocks Here for FREE.
Operating margin is a key measure of profitability. Think of it as net income – the bottom line – excluding the impact of taxes and interest on debt, which are less connected to business fundamentals.
PENN Entertainment’s operating margin has been trending up over the last 12 months and averaged 4% over the last two years. The company’s higher efficiency is a breath of fresh air, but its suboptimal cost structure means it still sports inadequate profitability for a consumer discretionary business.
PENN Entertainment Trailing 12-Month Operating Margin (GAAP)
This quarter, PENN Entertainment generated an operating margin profit margin of 5.5%, up 2.9 percentage points year on year. This increase was a welcome development and shows it was more efficient.
Revenue trends explain a company’s historical growth, but the long-term change in earnings per share (EPS) points to the profitability of that growth – for example, a company could inflate its sales through excessive spending on advertising and promotions.
Sadly for PENN Entertainment, its EPS declined by 25.8% annually over the last five years while its revenue grew by 13.6%. This tells us the company became less profitable on a per-share basis as it expanded due to non-fundamental factors such as interest expenses and taxes.
PENN Entertainment Trailing 12-Month EPS (Non-GAAP)
In Q1, PENN Entertainment reported adjusted EPS of $0.11, up from negative $0.25 in the same quarter last year. This print easily cleared analysts’ estimates, and shareholders should be content with the results. Over the next 12 months, Wall Street expects PENN Entertainment’s full-year EPS of $0.06 to grow 1,312%.
It was good to see PENN Entertainment beat analysts’ EPS expectations this quarter. We were also happy its revenue outperformed Wall Street’s estimates. On the other hand, its EBITDA missed. Zooming out, we think this was a mixed quarter. The stock remained flat at $14.81 immediately after reporting.